
This is our main data entry on plastics, with a particular focus on its pollution of the environment.
- We have also produced an FAQs on Plastics page which attempts to answer additional common questions on the topic.
- A slide-deck summary of global plastics is available here.
The first synthetic plastic — Bakelite — was produced in 1907, marking the beginning of the global plastics industry. However, rapid growth in global plastic production was not realized until the 1950s. Over the next 65 years, annual production of plastics increased nearly 200-fold to 381 million tonnes in 2015. For context, this is roughly equivalent to the mass of two-thirds of the world population.1
Summary
- Plastic pollution is having a negative impact on our oceans and wildlife health
- High-income countries generate more plastic waste per person
- However, it is the management of plastic waste that determines the risk of plastic entering the ocean. High-income countries have very effective waste management systems; mismanaged waste – and plastic that ends up in the oceans – is therefore very rare. Poor waste management across many middle- and low-income countries means that these are the main sources of global ocean plastic pollution
- This makes the improvement of waste management systems across the world critical to reducing plastic pollution.
- An estimated 20 percent of all plastic waste in the oceans comes from marine sources. In some regions, marine sources dominate: More than half of plastics in the Great Pacific Garbage Patch (GPGP) come from fishing nets, ropes and lines
- It is important to keep in mind that plastic is a unique material with many benefits: it’s cheap, versatile, lightweight, and resistant. This makes it a valuable material for many functions. It can also provide environmental benefits: it plays a critical role in maintaining food quality, safety and reducing food waste. The trade-offs between plastics and substitutes (or complete bans) are therefore complex and could create negative knock-on impacts on the environment.
All our charts on Plastic Pollution
How much plastic enters the world’s oceans?
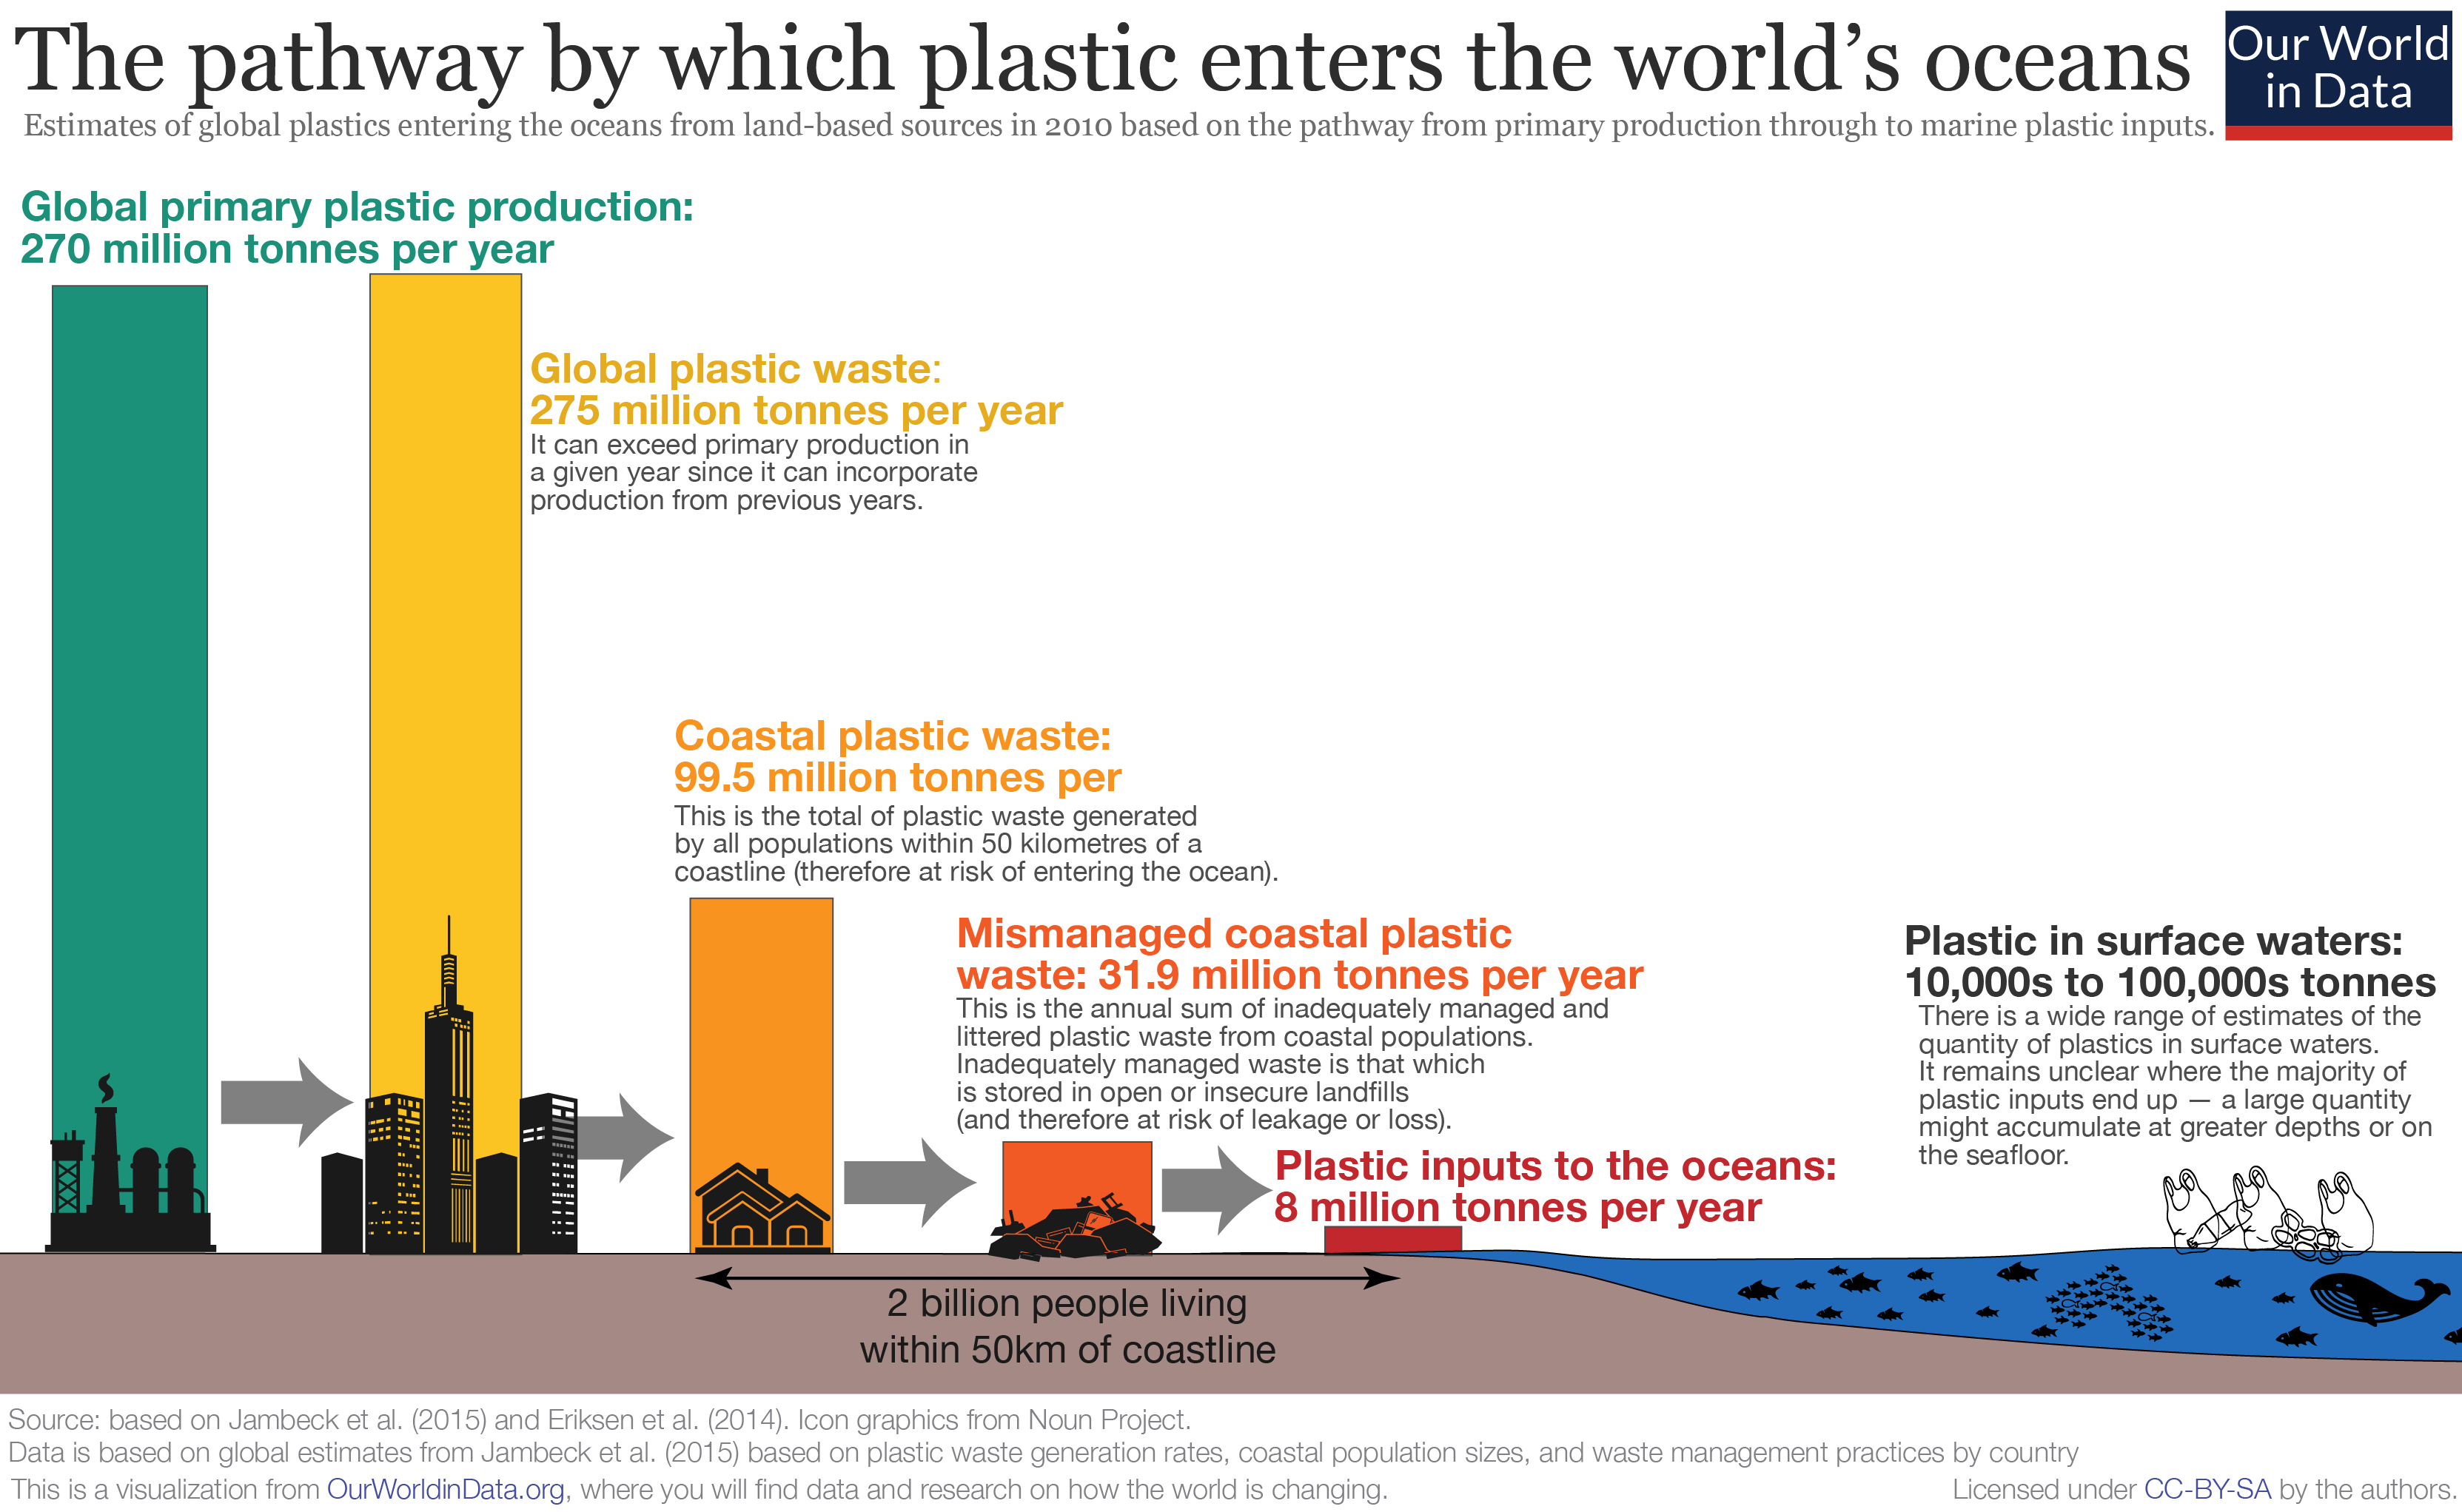
To understand the magnitude of input of plastics to the natural environment and the world’s oceans, we must understand various elements of the plastic production, distribution and waste management chain. This is crucial, not only in understanding the scale of the problem but in implementing the most effective interventions for reduction.
The data and visualizations which follow in this entry provide this overview step-by-step. This overview is summarized in the figure.2
Here we see that in 2010:
- global primary production of plastic was 270 million tonnes;
- global plastic waste was 275 million tonnes – it did exceed annual primary production through wastage of plastic from previous years;
- plastic waste generated in coastal regions is most at risk of entering the oceans; in 2010 coastal plastic waste – generated within 50 kilometres of the coastline – amounted to 99.5 million tonnes;
- only plastic waste which is improperly managed (mismanaged) is at significant risk of leakage to the environment; in 2010 this amounted to 31.9 million tonnes;
- of this, 8 million tones – 3% of global annual plastics waste – entered the ocean (through multiple outlets, including rivers);
- Plastics in the oceans’ surface waters are several orders of magnitude lower than annual ocean plastic inputs. This discrepancy is known as the ‘missing plastic problem’ and is discussed here.
- The amount of plastic in surface waters is not very well known: estimates range from 10,000s to 100,000s tonnes.
How much plastic does the world produce?
The chart shows the increase of global plastic production, measured in tonnes per year, from 1950 through to 2015.
In 1950 the world produced only 2 million tonnes per year. Since then, annual production has increased nearly 200-fold, reaching 381 million tonnes in 2015. For context, this is roughly equivalent to the mass of two-thirds of the world population.3
The short downturn in annual production in 2009 and 2010 was predominantly the result of the 2008 global financial crisis — a similar dent is seen across several metrics of resource production and consumption, including energy.
Cumulative production
How much plastic has the world produced cumulatively? The chart shows that by 2015, the world had produced 7.8 billion tonnes of plastic — more than one tonne of plastic for every person alive today.
How do we dispose of our plastic?
Plastic disposal methods
How has the global plastic waste disposal method changed over time? In the chart, we see the share of global plastic waste that is discarded, recycled or incinerated from 1980 through to 2015.
Prior to 1980, recycling and incineration of plastic was negligible; 100 percent was therefore discarded. From 1980 for incineration and 1990 for recycling, rates increased on average by about 0.7 percent per year.
In 2015, an estimated 55 percent of global plastic waste was discarded, 25 percent was incinerated, and 20 percent recycled.
If we extrapolate historical trends through to 2050 — as can be seen in the chart here — by 2050, incineration rates would increase to 50 percent; recycling to 44 percent; and discarded waste would fall to 6 percent. However, note that this is based on the simplistic extrapolation of historic trends and does not represent concrete projections.
Global plastic production to fate
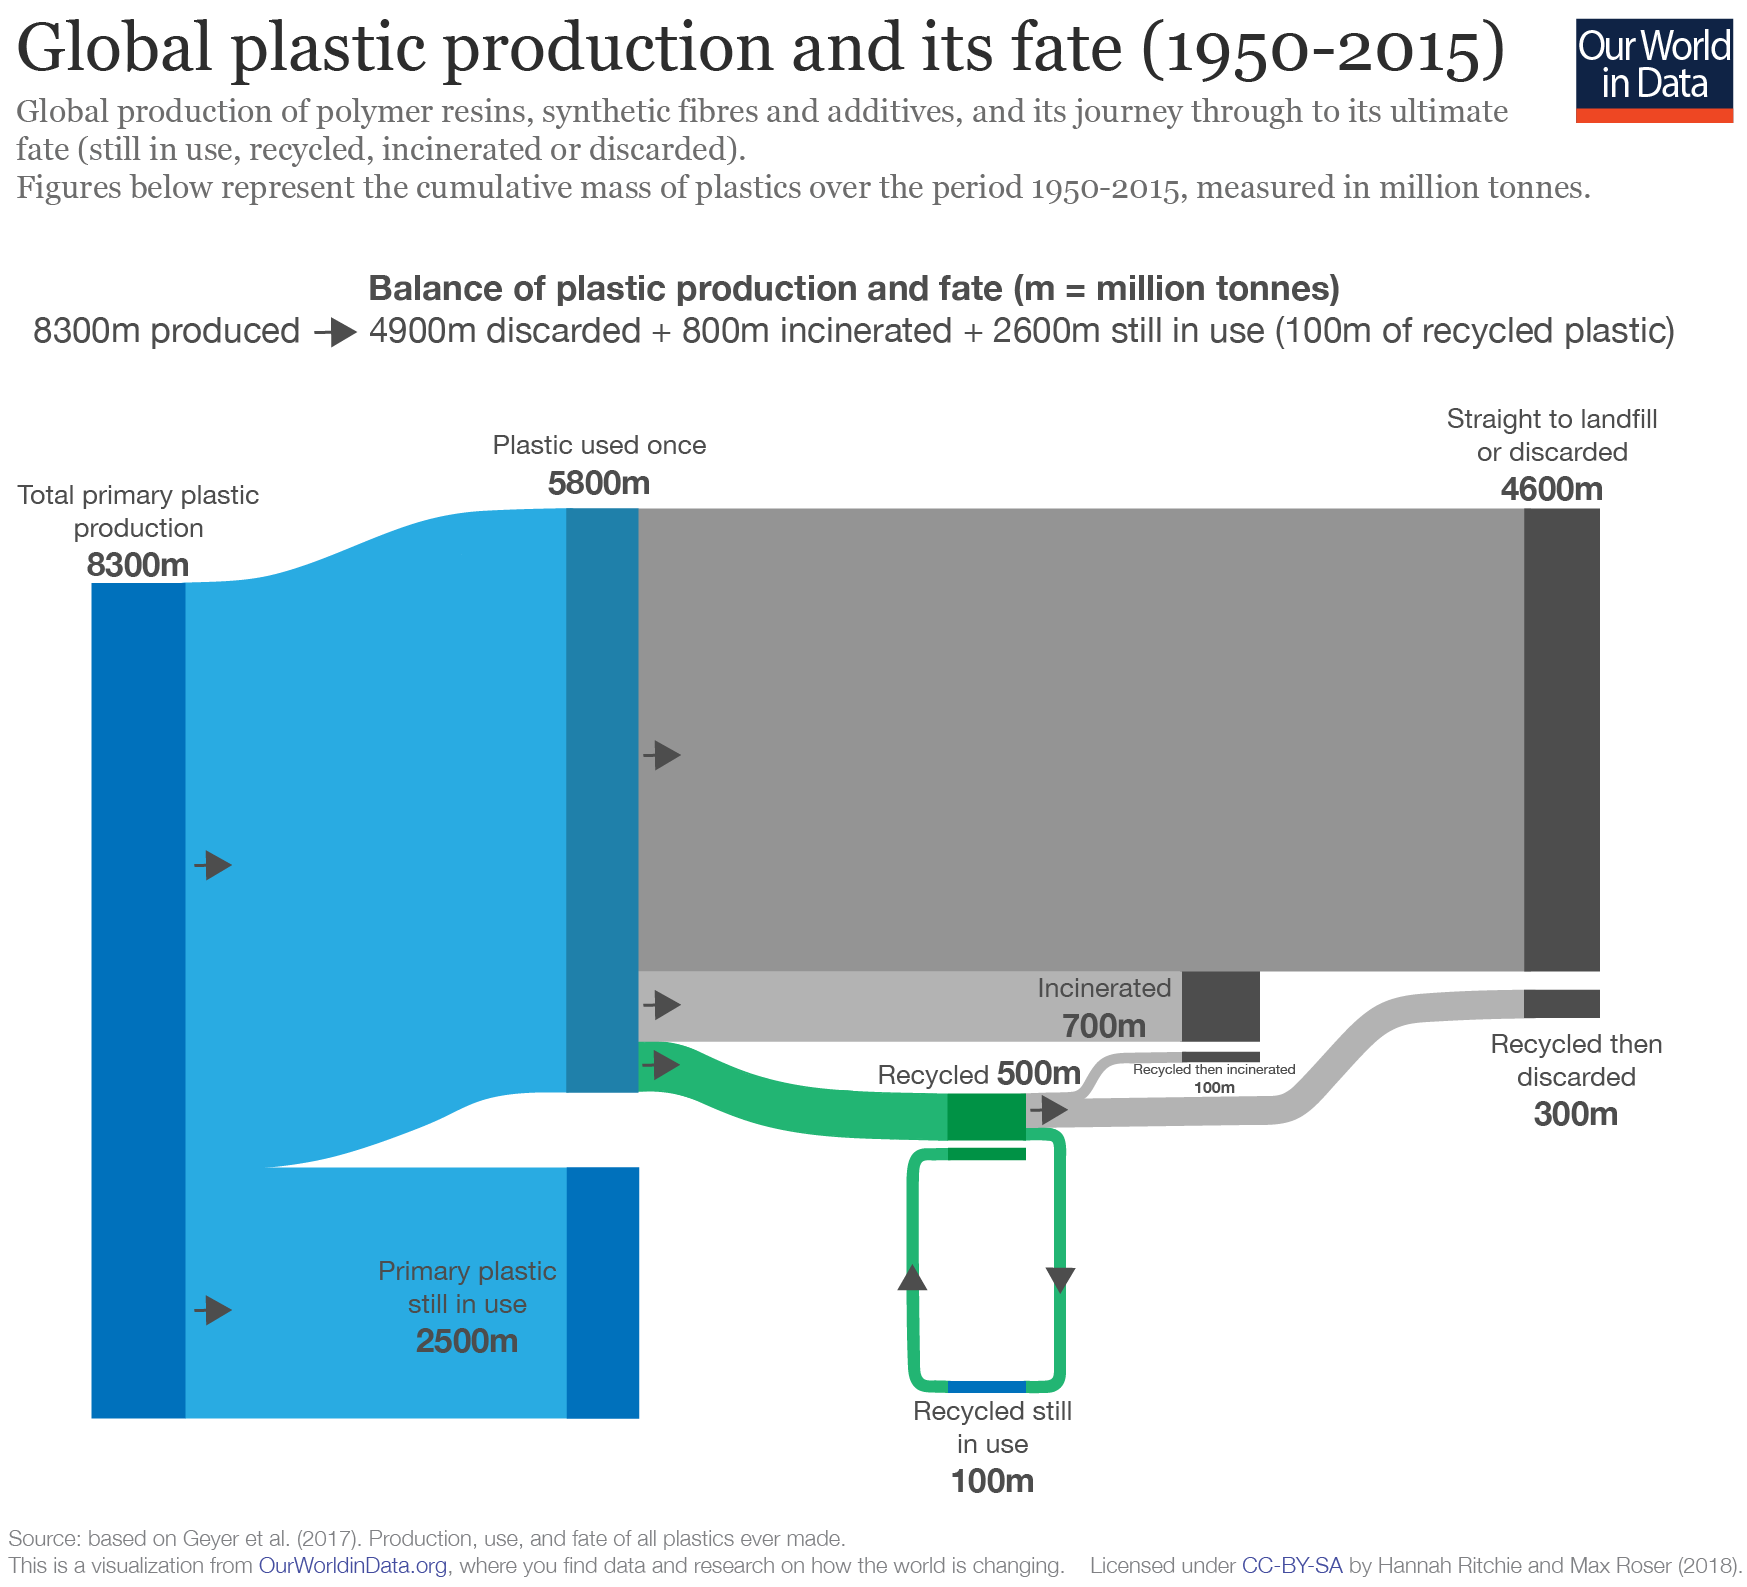
In the figure, we summarize global plastic production to final fate over the period 1950 to 2015.
This is given in cumulative million tonnes.
As shown:
- cumulative production of polymers, synthetic fibres and additives was 8300 million tonnes;
- 2500 million tonnes (30 percent) of primary plastics was still in use in 2015;
- 4600 million tonnes (55 percent) went straight to landfill or was discarded;
- 700 million tonnes (8 percent) was incinerated;
- 500 million tonnes (6 percent) was recycled (100 million tonnes of recycled plastic was still in use; 100 million tonnes was later incinerated, and 300 million tonnes was later discarded or sent to landfill).
Of the 5800 million tonnes of primary plastic no longer in use, only 9 percent has been recycled since 1950.
Which sectors produce the most plastic?
Plastic use by sector
To which industries and product use is primary plastic production allocated? In the chart, we see plastic production allocation by sector for 2015.
Packaging was the dominant use of primary plastics, with 42 percent of plastics entering the use phase.
Building and construction was the second-largest sector utilizing 19 percent of the total. Primary plastic production does not directly reflect plastic waste generation (as shown in the next section), since this is also influenced by the polymer type and lifetime of the end product.
Primary plastic production by polymer type can be found here.
Plastic waste by sector
This chart shows the use of primary plastics by sector; in the chart, we show these same sectors in terms of plastic waste generation. Plastic waste generation is strongly influenced by primary plastic use, but also by the product's lifetime.
Packaging, for example, has a very short ‘in-use' lifetime (typically around 6 months or less). This is in contrast to building and construction, where plastic use has a mean lifetime of 35 years.
Packaging is therefore the dominant generator of plastic waste, responsible for almost half of the global total.
In 2015, primary plastics production was 407 million tonnes; around three-quarters (302 million tonnes) ended up as waste.
Plastic waste breakdown by polymer type can be found here.
Which countries produce the most plastic waste?
IN THIS SECTION
- Plastic waste per person
- Total plastic waste by country
- Mismanaged plastic waste
- Share of global total mismanaged plastic waste
- Future mismanaged plastic
- How much ocean plastics come from land and marine sources?
Plastic waste per person
In the chart, we see the per capita rate of plastic waste generation, measured in kilograms per person per day. Here we see differences of around an order of magnitude: daily per capita plastic waste across the highest countries – Kuwait, Guyana, Germany, Netherlands, Ireland, the United States – is more than ten times higher than across many countries such as India, Tanzania, Mozambique and Bangladesh.
Note that these figures represent total plastic waste generation and do not account for differences in waste management, recycling or incineration. They, therefore, do not represent quantities of plastic at risk of loss to the ocean or other waterways.
Total plastic waste by country
In the chart, we see the total plastic waste generation by country, measured in tonnes per year. This, therefore, takes account of per capita waste generation and population size. This estimate is available only for the year 2010, but as we see later in this entry, the relative global picture is similar in projections to 2025.
With the largest population, China produced the largest quantity of plastic, at nearly 60 million tonnes. This was followed by the United States at 38 million, Germany at 14.5 million and Brazil at 12 million tonnes.
Like the per capita figures above, note that these figures represent total plastic waste generation and do not account for differences in waste management, recycling or incineration. They, therefore, do not represent quantities of plastic at risk of loss to the ocean or other waterways.
Beyond domestic plastic waste generation, there is also a large global commodity market for recycled plastic waste.
The global trade of plastic is discussed here.
Mismanaged plastic waste
Mismanaged waste is material that is at high risk of entering the ocean via wind or tidal transport, or carried to coastlines from inland waterways. Mismanaged waste is the sum of material that is either littered or inadequately disposed of. Inadequately disposed and littered waste are different and are defined in the sections below.
Share of plastic waste that is inadequately disposed
Inadequately disposed waste is that which has the intention of being managed through waste collection or storage sites but is ultimately not formally or sufficiently managed. This includes disposal in dumps or open, uncontrolled landfills; this means the material is not fully contained and can be lost to the surrounding environment. This makes it at risk of leakage and transport to the natural environment and oceans via waterways, winds and tides.
- High-income countries, including most of Europe, North America, Australia, New Zealand, Japan and South Korea have very effective waste management infrastructure and systems; this means discarded plastic waste (even that which is not recycled or incinerated) is stored in secure, closed landfills. Across such countries, almost no plastic waste is considered inadequately managed. Note this does not mean there is no plastic at risk of entering the natural environment — see the section on littering below.
- Across many low-to-middle-income income countries, inadequately disposed waste can be high; across many countries in South Asia and Sub-Saharan Africa, between 80-90 percent of plastic waste is inadequately disposed of, and therefore at risk of polluting rivers and oceans. This is strongly reflected in the global distribution of mismanaged waste and inputs from river systems.
Share of plastic waste that is littered
Littered waste is distinct from ‘inadequately disposed’ waste in that it represents plastics that are dumped or disposed of without consent in an inappropriate location.
Whilst high-income countries tend to have effective waste management infrastructure and therefore very small quantities of inadequately disposed waste, they can contribute to plastics pollution by littering. Jambeck et al. (2015) assume a rate of littering of 2 percent of total plastic waste generation across all countries.8
A global map of littered plastic from coastal populations (within 50 kilometres of a coastline) is shown here.
Share of global total mismanaged plastic waste
Whilst the global picture of total plastic waste tells an important story, it does not necessarily help us to understand the ocean plastic problem. To understand the sources of ocean plastic pollution we must take into account multiple factors: proximity of given population centres to the coast, and national waste management strategies. Not all of the plastic waste we generate is at high risk of entering the oceans; in fact, for many countries, the quantity which does end up as ocean pollution is very small.
Jambeck et al. (2015) attempted to quantify the amount of plastic that could eventually enter the ocean across the world.
To calculate this, the authors corrected total plastic waste generation rates in two fundamental ways:
(1) they quantified plastic waste generated by coastal populations (those within 50 kilometres of a coastline) — this represents plastic waste with the potential to be transported to the coast. Plastic waste generated further inland is unlikely to travel this distance.
(2) they corrected this figure for the quantity of plastic waste that is mismanaged. Mismanaged waste is the sum of inadequately managed waste (that which is not formally managed such as disposal in dumps or open, uncontrolled landfills which could leak to the surrounding environment) and littered waste. Mismanaged waste within coastal populations has strong potential to eventually enter the ocean either through transport by wind or tides or through waterways such as rivers or wastewater.
After correcting for these factors, the share of global mismanaged plastic waste by country is shown in the chart. This data is available to explore on a per capita basis and on an absolute basis (in tonnes per country). Note that whilst this data is available only for the year 2010, projections of global trends for the year 2025 (discussed in the section below) show a very similar distribution.
Here we see a very strong geographical clustering of mismanaged plastic waste, a high share of the world’s ocean plastics pollution has its origin in Asia. China contributes the highest share of mismanaged plastic waste with around 28 percent of the global total, followed by 10 percent in Indonesia, 6 percent for both the Philippines and Vietnam. Other leading countries include Thailand (3.2 percent); Egypt (3 percent); Nigeria (2.7 percent) and South Africa (2 percent). We discuss why such countries have high mismanaged plastic waste rates later in this entry.
Whilst many countries across Europe and North America had high rates of per capita plastic generation, once corrected for waste management, their contribution to mismanaged waste at risk of ocean pollution is significantly lower.
Mismanaged plastic by region
Mismanaged plastic by region
In the chart, we see the global distribution of mismanaged plastic waste aggregated by world region. The East Asia and Pacific region dominate global mismanaged plastic waste, accounting for 60 percent of the world total.
There is a wide gap between East Asia and the other regions — South Asia ranks second but contributes around 5 times less with 11 percent of the total. This is followed by Sub-Saharan Africa (9 percent); the Middle East & North Africa (8.3 percent); Latin America (7.2 percent); Europe and Central Asia (3.6 percent) and North America (1 percent).
If we aim to address the ocean plastic problem, an understanding of this global picture is important. It highlights the fundamental role of waste management in preventing ocean pollution; whilst countries across North America and Europe generate significant quantities of plastic waste (particularly on a per capita basis), well-managed waste streams mean that very little of this is at risk of ocean pollution. In fact, if North America & Europe were to completely eliminate plastic use, global mismanaged plastic would decline by less than 5 percent.10
Future mismanaged plastic
The data presented in the analysis above is for the year 2010; how is this global picture likely to change over time? Jambeck et al. (2015) also project mismanaged plastic waste production for the year 2025.11
These results are presented in the map as the share of global mismanaged waste by country and aggregated by region. Absolute figures (in tonnes per year) by country are available to explore here.
Overall we see that the global distribution is projected to change only slightly; whilst China’s contribution falls by a couple of percentage points, East Asia & Pacific maintain around 60 percent of the total. South Asia’s contribution — largely driven by India — increases slightly, as does Sub-Saharan Africa. Latin America, the Middle East & North Africa, Europe and North America all fall in relative terms.
How much ocean plastics come from land and marine sources?
Plastic in our oceans can arise from both land-based or marine sources. Plastics pollution from marine sources refers to the pollution caused by fishing fleets that leave behind fishing nets, lines, ropes, and sometimes abandoned vessels.
There is often intense debate about the relative importance of marine and land sources for ocean pollution. What is the relative contribution of each?
At the global level, best estimates suggest that approximately 80 percent of ocean plastics come from land-based sources and the remaining 20 percent from marine sources.
Of the 20 percent from marine sources, it’s estimated that around half (10 percentage points) arises from fishing fleets (such as nets, lines and abandoned vessels). This is supported by figures from the United Nations Environment Programme (UNEP) which suggests abandoned, lost or discarded fishing gear contributes approximately 10 percent to total ocean plastics.
Other estimates allocate a slightly higher contribution of marine sources, at 28 percent of total ocean plastics.
Although uncertain, it’s likely that marine sources contribute between 20-30 percent of ocean plastics, but the dominant source remains land-based input at 70-80 percent.
Whilst this is the relative contribution as an aggregate of global ocean plastics, the relative contribution of different sources will vary depending on geographical location and context. For example, its estimated that plastic lines, ropes and fishing nets comprise 52 percent of the plastic mass in the ‘Great Pacific Garbage Patch’ (GPGP) (and comprises 46 percent of the megaplastics component of the GPGP).
The relative contribution of marine sources here is likely to be the result of intensified fishing activity in the Pacific Ocean.
River inputs to the ocean
There are multiple routes by which plastic can enter the ocean environment. One key input is through river systems. This can transport plastic waste from further inland to coastal areas where it can enter the ocean. As we see in the following charts, there is a high concentration of plastic within river systems geographically.
Top 20 river sources
In the chart, we list the estimated input of plastic to the oceans from the most polluting rivers across the world. This was estimated by Lebreton et al. (2017) for the year 2015. They are listed in order with the name of the river, and the countries through which it passes.
The top 20 polluting rivers accounted for two-thirds – 67 percent – of the global annual river input. Geographically we see that the majority of the most polluting rivers are located in Asia. River Yangtze, the top polluting river, had an input of approximately 333,000 tonnes in 2015 — over 4 percent of annual ocean plastic pollution.
River inputs by region
In the chart we see river plastic inputs to the ocean aggregated by region — this is given as a share of the global total.
Most river plastic originates from Asia, which represents 86 percent of the global total. This is followed by Africa at 7.8 percent, and South America at 4.8 percent.
Collectively, Central & North America, Europe and the Australia-Pacific region account for just over one percent of the world total.
Which oceans have the most plastic waste?
Plastic enters the oceans from coastlines, rivers, tides, and marine sources. But once it is there, where does it go?
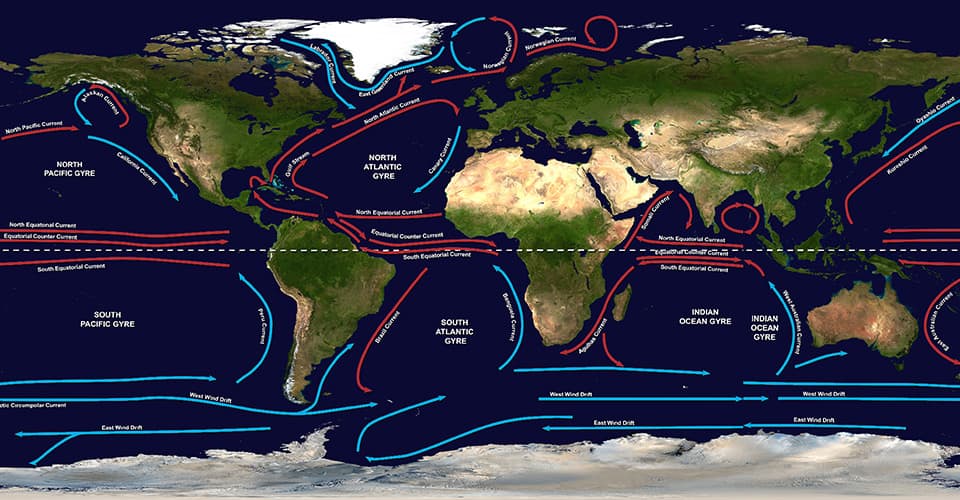
The distribution and accumulation of ocean plastics are strongly influenced by oceanic surface currents and wind patterns. Plastics are typically buoyant – meaning they float on the ocean surface –, allowing them to be transported by the prevalent wind and surface current routes. As a result, plastics tend to accumulate in oceanic gyres, with high concentrations of plastics at the centre of ocean basins, and much less around the perimeters. After entry to oceans from coastal regions, plastics tend to migrate towards the centre of ocean basins.
In the chart, we see estimates of the mass of plastics in surface ocean waters by ocean basin. Eriksen et al. (2014) estimated that there were approximately 269,000 tonnes of plastic in surface waters across the world.
Note that this is at least an order of magnitude lower than estimated inputs of plastics to the ocean; the discrepancy here relates to a surprising, but long-standing question in the research literature on plastics: “where is the missing plastic going?“.
As we see, basins in the Northern Hemisphere had the highest quantity of plastics. This would be expected since the majority of the world’s population – and in particular, coastal populations – live within the Northern Hemisphere. However, authors were still surprised by the quantity of plastic accumulation in Southern oceans — while it was lower than in the Northern Hemisphere, it was still of the same order of magnitude. Considering the lack of coastal populations and plastic inputs in the Southern Hemisphere, this was an unexpected result. The authors suggest this means plastic pollution can be moved between oceanic gyres and basins much more readily than previously assumed.
Plastic particles in the world’s surface ocean
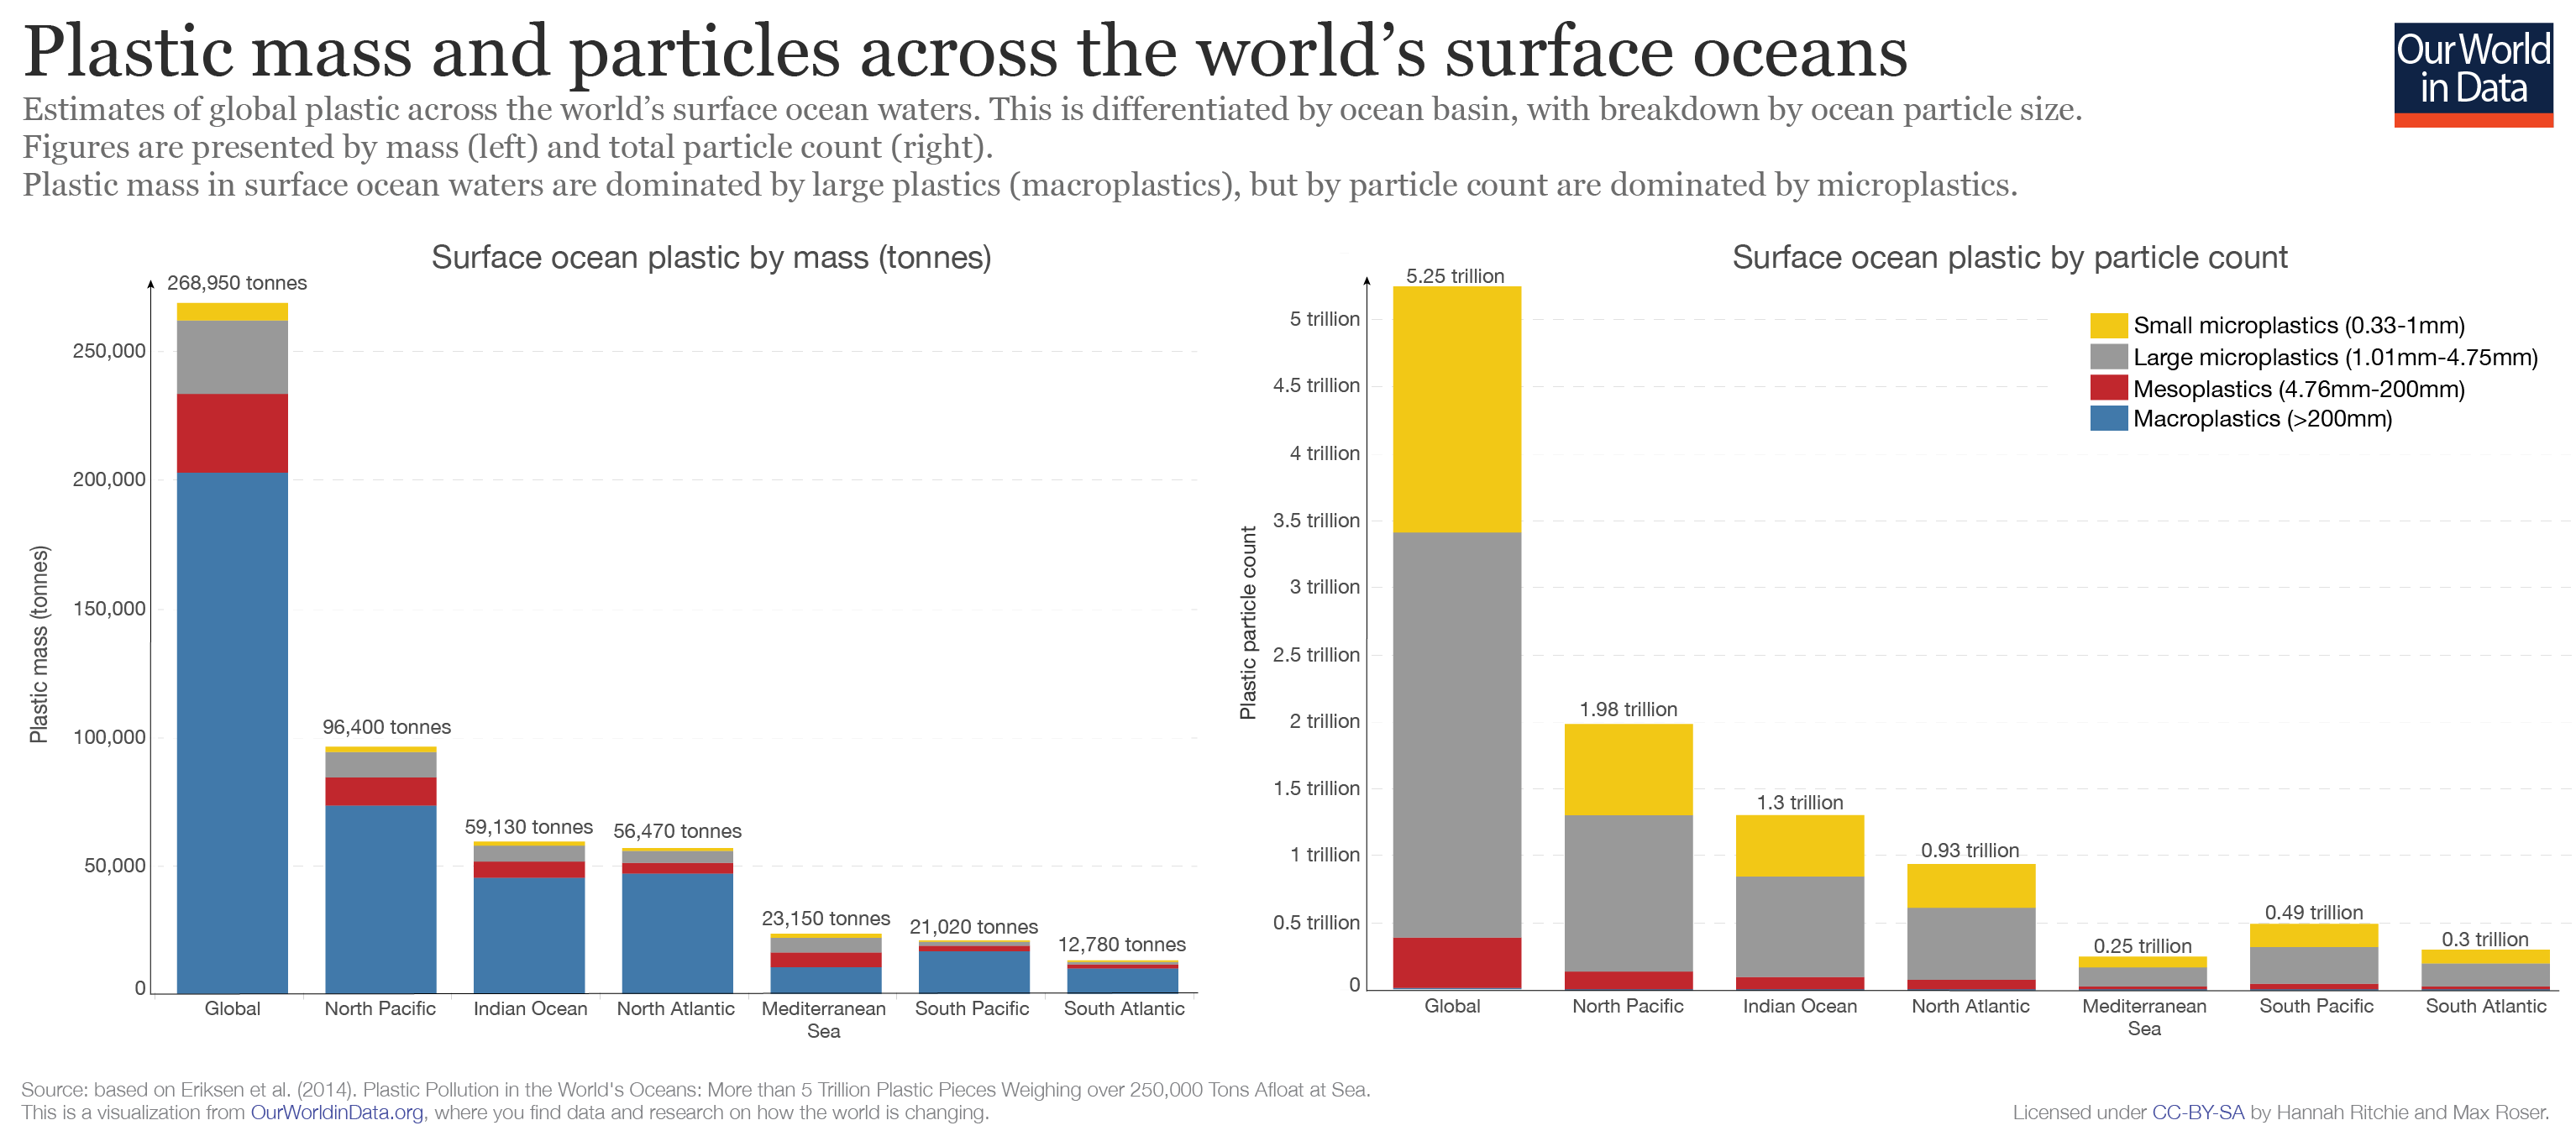
It’s estimated that there are more than 5 trillion plastic particles in the world’s surface waters.
We can see this breakdown of plastic particles by the ocean basin here. The accumulation of a large number of particles tends to result from the breakdown of larger plastics — this results in an accumulation of plastic particles for a given mass.
The figure summarizes plastics in the ocean surface waters by basin. This is shown by particle size in terms of mass (left) and particle count (right). As shown, the majority of plastics by mass are large particles (macroplastics), whereas the majority in terms of particle count are microplastics (small particles).
The ‘Great Pacific Garbage Patch’ (GPGP)
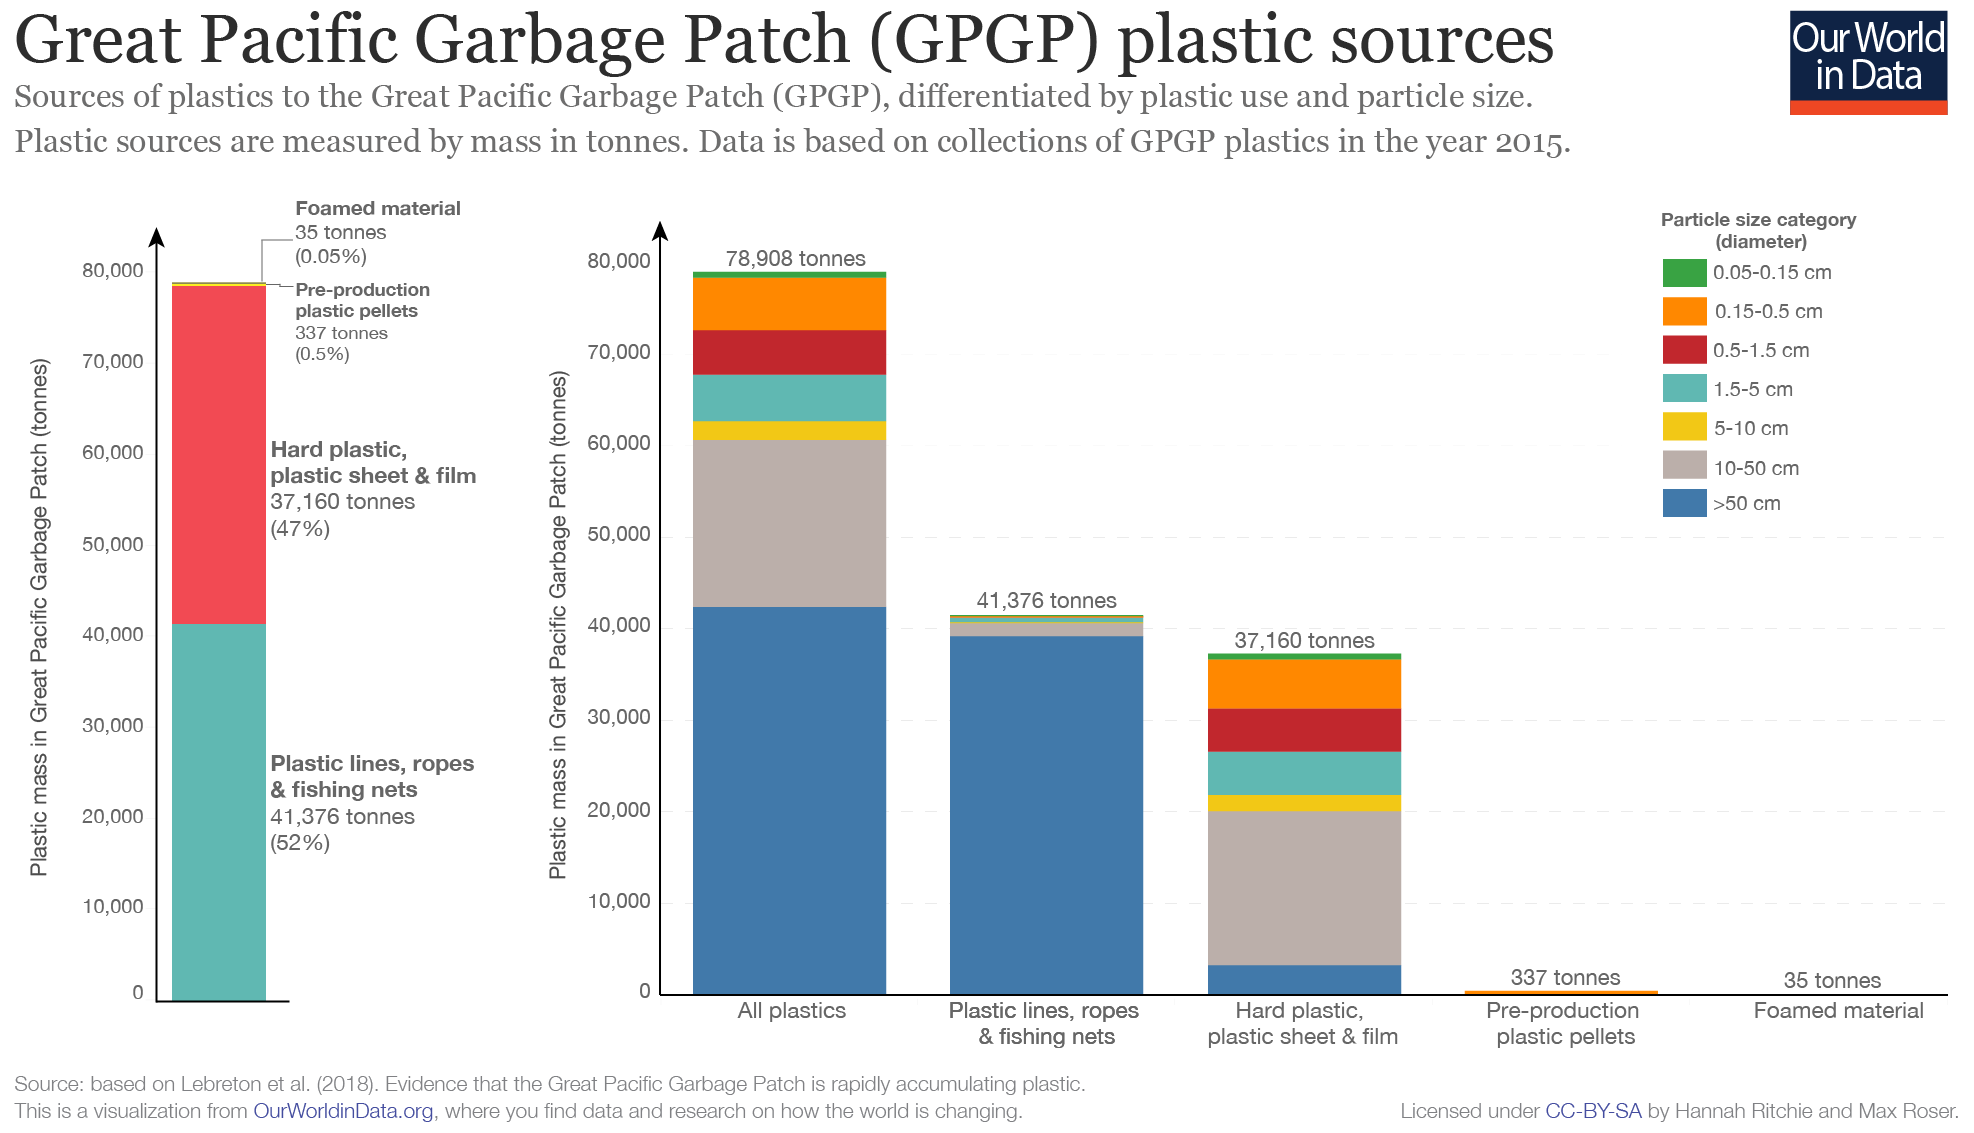
The most well-known example of large plastic accumulations in surface waters is the so-called ‘Great Pacific Garbage Patch’ (GPGP). As shown in the chart here, the largest accumulation of plastics within ocean basins is the North Pacific. This results from the combined impact of large coastal plastic inputs in the region, alongside intensive fishing activity in the Pacific ocean.
In a Nature study, Lebreton et al. (2018) attempted to quantify the characteristics of the GPGP.
The vast majority of GPGP material is plastics — trawling samples indicate an estimated 99.9 percent of all floating debris. The authors estimate the GPGP spanned 1.6 million km2. This is just over three times the area of Spain, and slightly larger in the area to Alaska (the USA’s largest state).
The GPGP comprised 1.8 trillion pieces of plastic, with a mass of 79,000 tonnes (approximately 29 percent of the 269,000 tonnes in the world’s surface oceans). Over recent decades, the authors report there has been an exponential increase in the concentration of surface plastics in the GPGP.
In the chart, we see the estimated composition of the GPGP plastic. Around 52 percent of plastics originated from fishing activity and included fishing lines, nets and ropes; a further 47 percent was sourced from hard plastics, sheets and films; and the remaining components were small in comparison (just under one percent). The dominance of fishing lines, nets, hard plastics and films means that most of the mass in the GPGP had a large particle size (meso- and macroplastics).
Where does our plastic accumulate in the ocean and what does that mean for the future?

The world now produces more than 380 million tonnes of plastic every year, which could end up as pollutants, entering our natural environment and oceans.
Of course, not all of our plastic waste ends up in the ocean, most ends up in landfills: it’s estimated that the share of global plastic waste that enters the ocean is around 3%. In 2010 – the year for which we have the latest estimates – that was around 8 million tonnes.
Most of the plastic materials we produce are less dense than water and should therefore float at the ocean surface. But our best estimates of the amount of plastic afloat at sea are orders of magnitude lower than the amount of plastic that enters our oceans in a single year: as we show in the visualization, it’s far lower than 8 million tonnes and instead in the order of 10s to 100s of thousands of tonnes. One of the most widely-quoted estimates is 250,000 tonnes.
If we currently pollute our oceans with millions of tonnes of plastic each year, we must have released tens of millions of tonnes in recent decades. Why then do we find at least 100 times less plastics in our surface waters?
This discrepancy is often referred to as the ‘missing plastic problem’. It’s a conundrum we need to address if we want to understand where plastic waste could end up, and what its impacts might be for wildlife, ecosystems and health.
The ‘missing plastic problem’
There are several hypotheses to explain the ‘missing plastic problem’.
One possibility is that it is due to imprecise measurement: we might either grossly overestimate the amount of plastic waste we release into the ocean, or underestimate the amount floating in the surface ocean. Whilst we know that tracking ocean plastic inputs and their distribution is notoriously difficult the levels of uncertainty in these measurements are much less than the several orders of magnitude that would be needed to explain the missing plastic problem.
Another popular hypothesis is that ultraviolet light (UV) and mechanical wave forces break large pieces of plastic into smaller ones. These smaller particles, referred to as microplastics, are much more easily incorporated into sediments or ingested by organisms. And this is where the missing plastic might end up.
One proposed ‘sink’ for ocean plastics was deep-sea sediments; a study that sampled deep-sea sediments across several basins found that microplastic was up to four orders of magnitude more abundant (per unit volume) in deep-sea sediments from the Atlantic Ocean, the Mediterranean Sea and the Indian Ocean than in plastic-polluted surface waters.
But, new research may suggest a third explanation: those plastics in the ocean break down slower than previously thought, and that much of the missing plastic is washed up or buried in our shorelines.
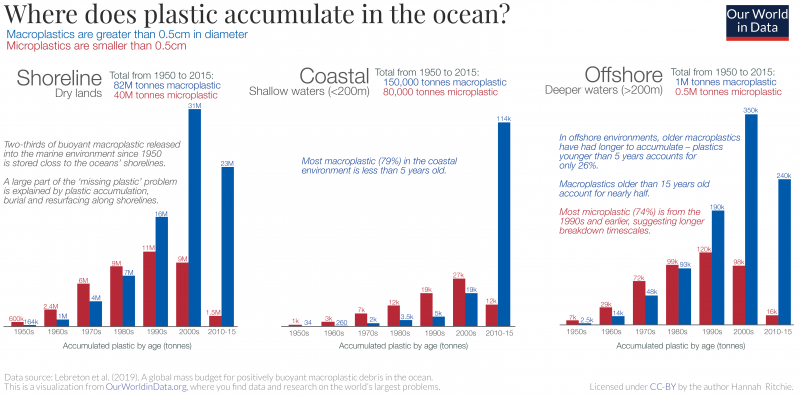
Plastics persist for decades and accumulate on our shorelines

To try to understand the conundrum of what happens to plastic waste when it enters the ocean, Lebreton, Egger and Slat (2019) created a global model of ocean plastics from 1950 to 2015. This model uses data on global plastic production, emissions into the ocean by plastic-type and age, and transport and degradation rates to map not only the amount of plastic in different environments in the ocean but also its age.
The authors aimed to quantify where plastic accumulates in the ocean across three environments: the shoreline (defined as dry land bordering the ocean), coastal areas (defined as waters with a depth less than 200 meters) and offshore (waters with a depth greater than 200 meters). They wanted to understand where plastic accumulates, and how old it is: a few years old, ten years or decades?
In the visualization, I summarized their results. This is shown for two categories of plastics: shown in blue are ‘macroplastics’ (larger plastic materials greater than 0.5 centimetres in diameter) and shown in red microplastics (smaller particles less than 0.5 centimetres).
There are some key points we can take away from the visualization:
- The vast majority – 82 million tonnes of microplastics and 40 million tonnes of microplastics – is washed up, buried or resurfaced along the world’s shorelines.
- Much of the macroplastics in our shorelines is from the past 15 years, but still, a significant amount is older suggesting it can persist for several decades without breaking down.
- In coastal regions, most macroplastics (79%) are recent – less than 5 years old.
- In offshore environments, older microplastics have had longer to accumulate than in coastal regions. These macroplastics from several decades ago – even as far back as the 1950s and 1960s – persist.
- Most microplastics (three-quarters) in offshore environments are from the 1990s and earlier, suggesting it can take several decades for plastics to break down.
What does this mean for our understanding of the ‘missing plastic’ problem? Firstly, is that the majority of ocean plastics are washed, buried and resurface along our shorelines. Whilst we try to tally ocean inputs with the amount floating in gyres at the centre of our oceans, most of it may be accumulating around the edges of the oceans. This would explain why we find much less in surface waters than we’d expect.
Secondly, accumulated plastics are much older than previously thought. Macroplastics appear to persist on the surface of the ocean for decades without breaking down. Offshore we find large plastic objects dating as far back as the 1950s and 1960s. This goes against previous hypotheses of the ‘missing plastic’ problem which suggested that UV light and wave action degrade and remove them from the surface in only a few years.
How much plastic will remain in surface oceans in the coming decades?
The study by Lebreton, Egger and Slat challenges the previous hypotheses that plastics in the surface ocean have a very short lifetime, quickly degrade into microplastics and sink to greater depths. Their results suggest that macroplastics can persist for decades; can be buried and resurfaced along shorelines, and end up in offshore regions years later.
If true, this matters a lot for how much plastic we would expect in our surface oceans in the decades which follow. The same study also modelled how the mass of plastics – both macro and micro – in the world’s surface waters might evolve under three scenarios:
- we stop emitting any plastics to our oceans by 2020;
- ‘emissions’ of plastic to the ocean continue to increase until 2020 then level off;
- ‘emissions’ continue to grow to 2050 in line with historic growth rates.30
Their results are shown in the charts.
The scenarios of continued emissions growth are what we’d expect: if we continue to release more plastics to the ocean, we’ll have more in our surface waters.
What’s more striking is that even if we stopped ocean plastic waste by 2020, macroplastics would persist in our surface waters for many more decades. This is because we have a large legacy of plastics buried and awash on our shorelines which would continue to resurface and be transported to offshore regions, and existing plastics can persist in the ocean environment for many decades.
The number of microplastics in our surface ocean will increase under every scenario because the large plastics that we already have on our shorelines and surface waters will continue to break down. And, any additional plastics we add will contribute further.
This also matters for how we solve the problem of ocean pollution.
If we want to rapidly reduce the amount of both macro-and microplastics in our oceans, these results suggest two priorities:
Number one — we must stop plastic waste from entering our waterways as soon as possible. Most of the plastic that ends up in our oceans does so because of poor waste management practices – particularly in low-to-middle income countries; this means that good waste management across the world is essential to achieving this.

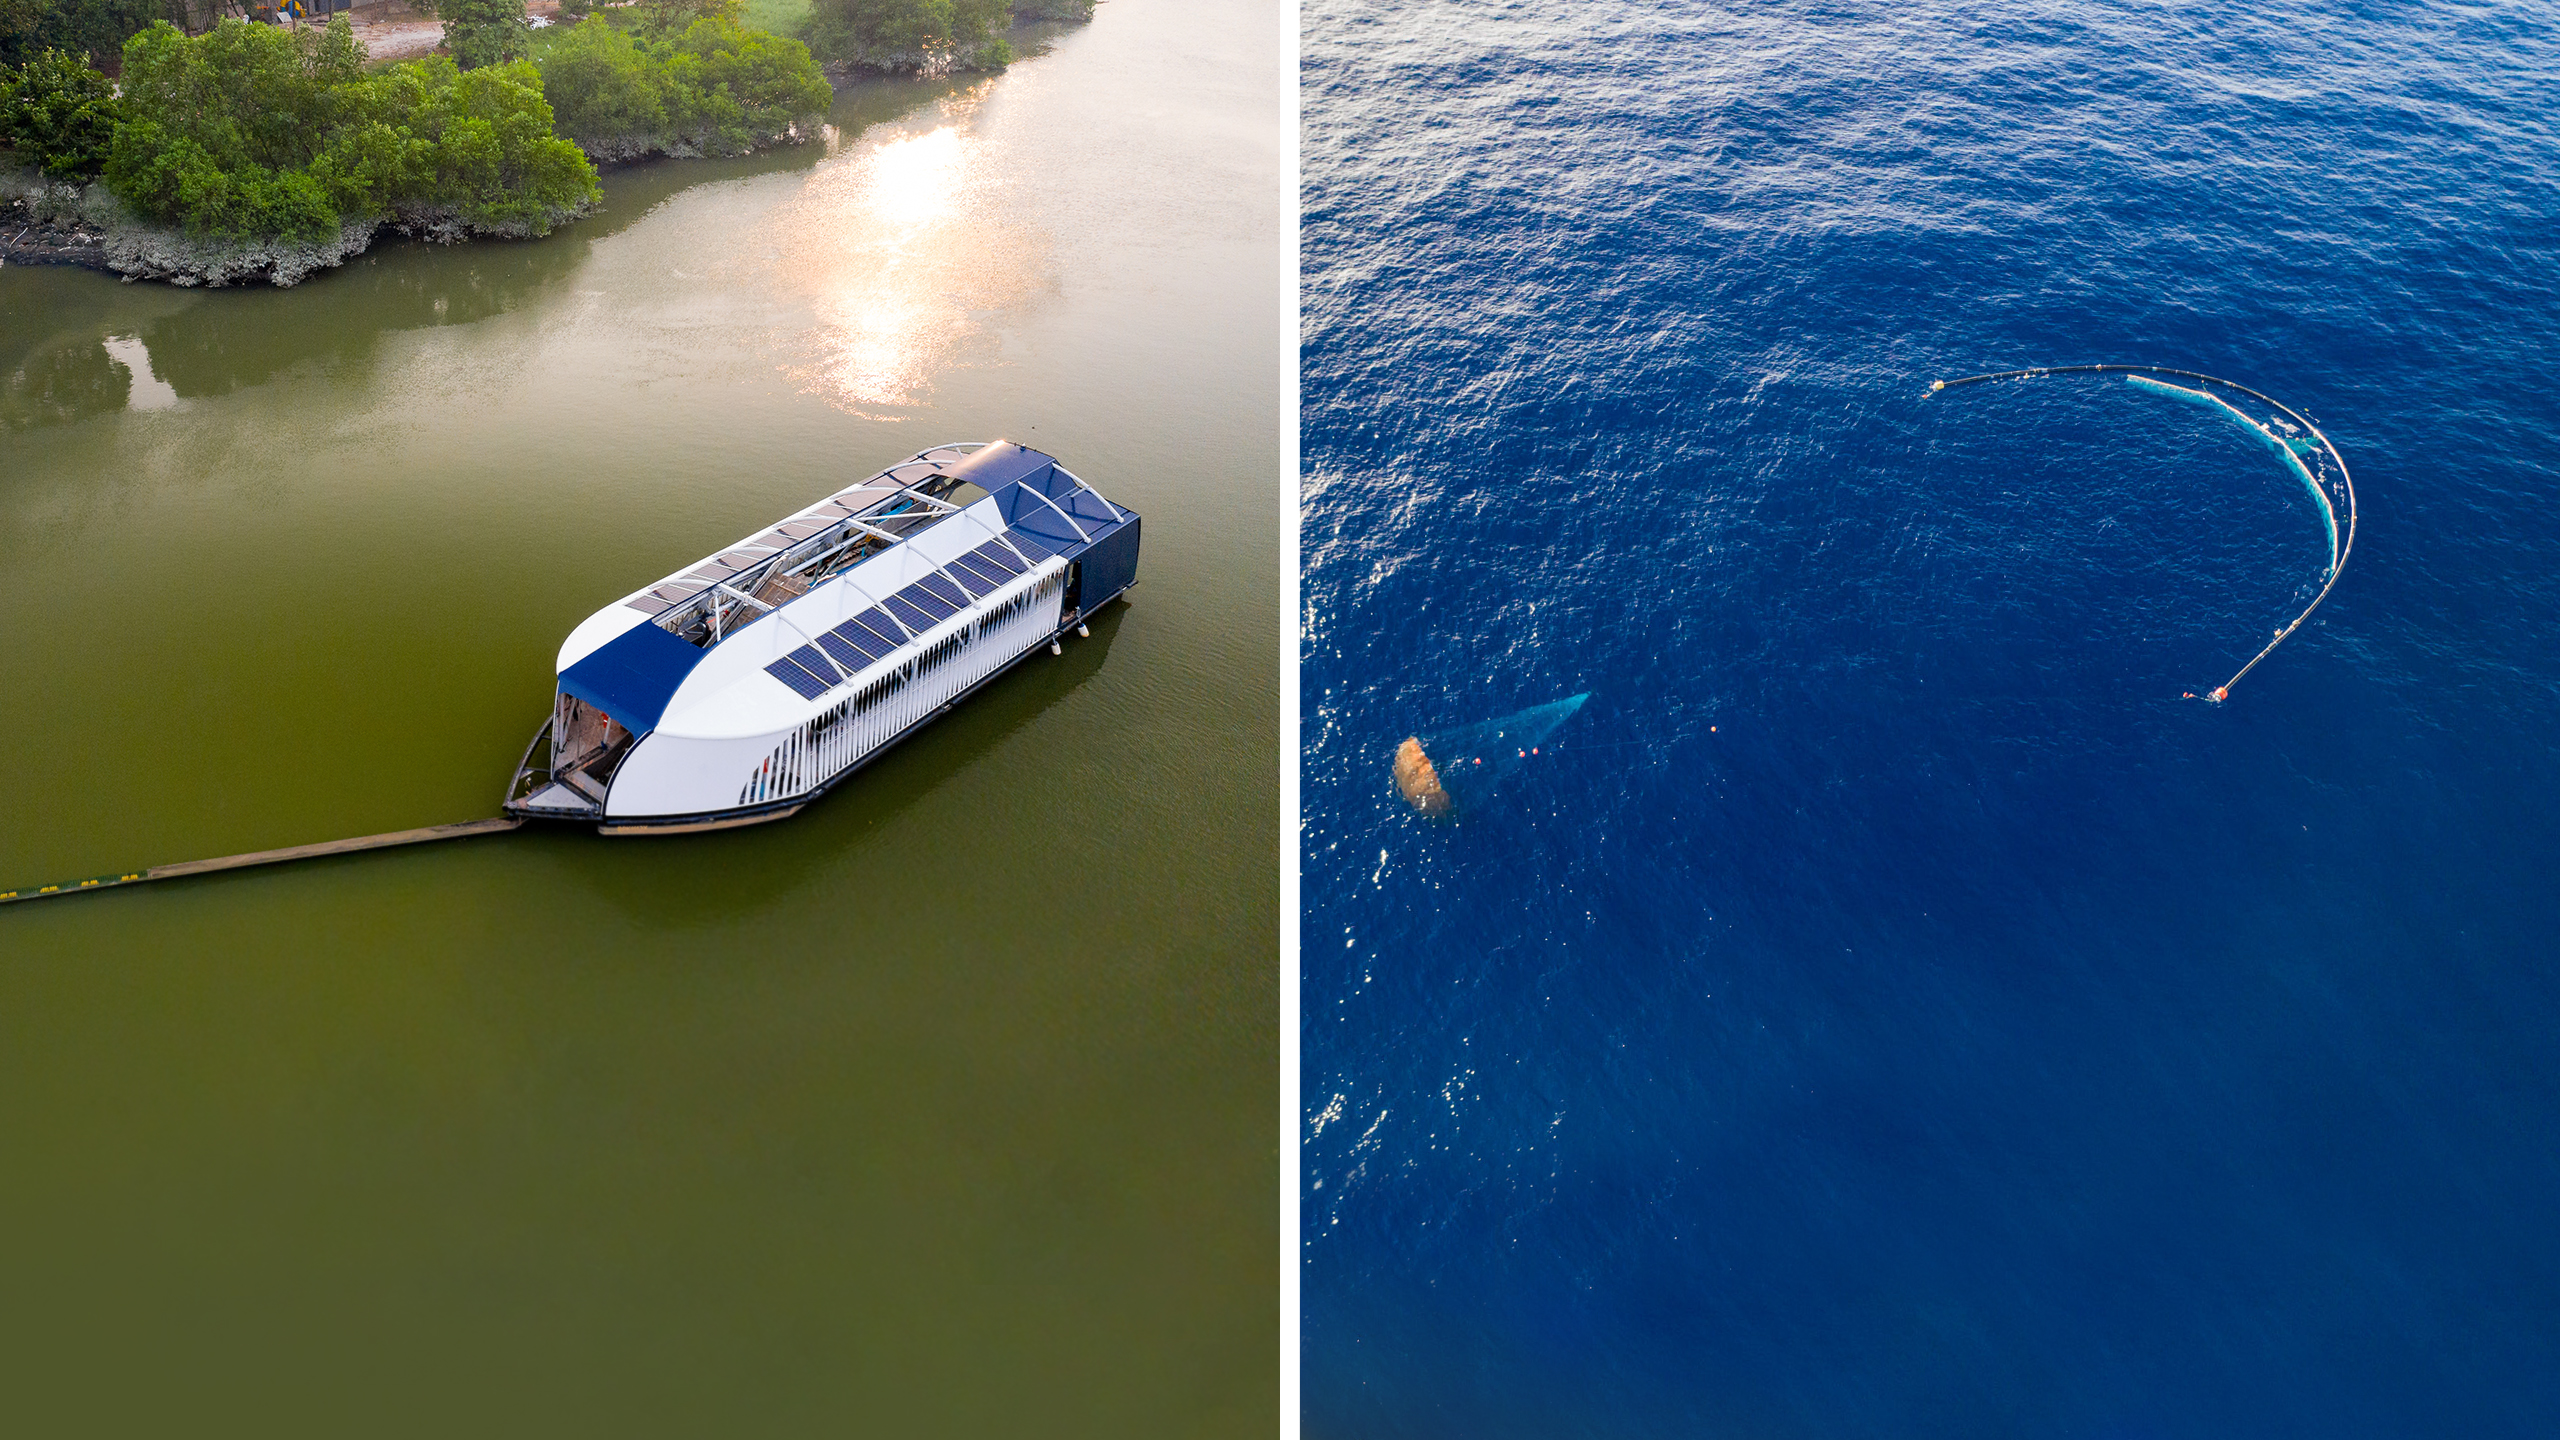
But this ambitious target alone will not be enough. We have many decades of legacy waste to contend with. This makes a second priority necessary— we have to focus our efforts on recapturing and removing plastics already in our offshore waters and shorelines. This is the goal of Slat, Lebreton and Egger – the authors of this paper – with their Ocean Cleanup project.
How does plastic impact wildlife and human health?
IN THIS SECTION
- What are the impacts of microplastics on health?
There have been many documented incidences of the impact of plastic on ecosystems and wildlife. Peer-reviewed publications of plastic impacts date back to the 1980s.
An analysis by Rochman et al. (2016) reviews the findings of peer-reviewed documentation of the impacts of marine plastic debris on animal life; the results of this study are presented in this table.
Nonetheless, despite many documented cases, it’s widely acknowledged that the full extent of impacts on ecosystems is not yet known.
There are three key pathways by which plastic debris can affect wildlife:
Entanglement – the entrapping, encircling or constricting of marine animals by plastic debris.
Entanglement cases have been reported for at least 344 species to date, including all marine turtle species, more than two-thirds of seal species, one-third of whale species, and one-quarter of seabirds. Entanglement by 89 species of fish and 92 species of invertebrates has also been recorded.
Entanglements most commonly involve plastic rope and netting and abandoned fishing gear. However, entanglement by other plastics such as packaging have also been recorded.
Ingestion:
Ingestion of plastic can occur unintentionally, intentionally, or indirectly through the ingestion of prey species containing plastic.
It has been documented for at least 233 marine species, including all marine turtle species, more than one-third of seal species, 59% of whale species, and 59% of seabirds. Ingestion by 92 species of fish and 6 species of invertebrates has also been recorded.
The size of the ingested material is ultimately limited by the size of the organism. Very small particles such as plastic fibres can be taken up by small organisms such as filter-feeding oysters or mussels; larger materials such as plastic films, cigarette packets, and food packaging have been found in large fish species; and in extreme cases, documented cases of sperm whales have shown ingestion of very large materials including 9m of rope, 4.5m of hose, two flowerpots, and large amounts of plastic sheeting.
Ingestion of plastics can have multiple impacts on organism health. Large volumes of plastic can greatly reduce stomach capacity, leading to poor appetite and the false sense of satiation. Plastic can also obstruct or perforate the gut, cause ulcerative lesions, or gastric rupture. This can ultimately lead to death.
In laboratory settings, biochemical responses to plastic ingestion have also been observed. These responses include oxidative stress, metabolic disruption, reduced enzyme activity, and cellular necrosis.
Interaction – interaction includes collisions, obstructions, abrasions or use as a substrate.
There are multiple scenarios where this can have an impact on organisms.
Fishing gear, for example, has been shown to cause abrasion and damage to coral reef ecosystems upon collision. Ecosystem structures can also be impacted by plastics following interference of substrate with plastics (impacting on light penetration, organic matter availability and oxygen exchange).
What are the impacts of microplastics on health?
Impact of microplastics on wildlife
As discussed in the section on ‘Impacts on Wildlife’ above, there are several ways in which plastics can interact or influence wildlife. In the case of microplastics (particles smaller than 4.75 millimetres in diameter), the key concern is ingestion.
Ingestion of microplastics has been shown to occur for many organisms. This can occur through several mechanisms, ranging from uptake by filter-feeders, swallowing from the surrounding water, or consumption of organisms that have previously ingested microplastics.
There are a number of potential effects of microplastics at different biological levels, which range from sub-cellular to ecosystems, but most research has focused on impacts in individual adult organisms.
Microplastic ingestion rarely causes mortality in any organism. As such, ‘lethal concentration’ (LC) values which are often measured and reported for contaminants do not exist. There are a few exceptions: common goby exposure to polyethylene and pyrene; Asian green mussels exposed to polyvinylchloride (PVC); and Daphnia magna neonates exposed to polyethylene.
 Contributors to Wikimedia projects
.jpg/1200px-Rhinogobius_sp._CB(Hamamatsu%2CShizuoka%2CJapan).jpg)
In such studies, however, concentrations and exposure to microplastics far exceeded levels that would be encountered in the natural environment (even a highly contaminated one).
There are increasing evidence that microplastic ingestion can affect the consumption of prey, leading to energy depletion, inhibited growth and fertility impacts. When organisms ingest microplastics, it can take up space in the gut and digestive system, leading to reductions in feeding signals. This feeling of fullness can reduce dietary intake. Evidence of impacts of reduced food consumption include:
- slower metabolic rate and survival in Asian green mussels
- reduced reproducibility and survival in copepods
- reduced growth and development of Daphnia
- reduced growth and development of langoustine
- reduced energy stores inshore crabs and lugworms
Many organisms do not exhibit changes in feeding after microplastic ingestion. A number of organisms, including suspension-feeders (for example, oyster larvae, urchin larvae, European flat oysters, Pacific oysters) and detritivorous (for example, isopods, amphipods) invertebrates show no impact on microplastics. Overall, however, it’s likely that for some organisms, the presence of microplastic particles in the gut (where food should be) can have negative biological impacts.
Impact of microplastics on humans
There is, currently, very little evidence of the impact that microplastics can have on humans.
For human health, it is the smallest particles – micro-and nano-particles which are small enough to be ingested – that are of greatest concern. There are several ways by which plastic particles can be ingested: orally through water, consumption of marine products which contain microplastics, through the skin via cosmetics (identified as highly unlikely but possible), or inhalation of particles in the air.
It is possible for microplastics to be passed up to higher levels in the food chain. This can occur when a species consumes organisms of a lower level in the food chain which has microplastics in the gut or tissue.56 The presence of microplastics at higher levels of the food chain (in fish) has been documented.
One factor which possibly limits the dietary uptake for humans is that microplastics in fish tend to be present in the gut and digestive tract — parts of the fish not typically eaten. The presence of microplastics in fish beyond the gastrointestinal tract (e.g. in tissue) remains to be studied in detail. Micro- and nano plastics in bivalves (mussels and oysters) cultured for human consumption have also been identified. However, neither human exposure nor potential risk has been identified or quantified.
Plastic fibres have also been detected in other food items; for example, honey, beer and table salt. But the authors suggested negligible health risks as a result of this exposure.
Levels of microplastic ingestion are currently unknown. Even less is known about how such particles interact in the body. It may be the case that microplastics simply pass straight through the gastrointestinal tract without impact or interaction. A study of North Sea fish, for example, revealed that 80 percent of fish with detected microplastics contained only one particle — this suggests that following ingestion, plastic does not persist for long periods of time. Concentrations in mussels, in contrast, can be significantly higher.
What could cause concern about the impact of microplastics?
Three possible toxic effects of plastic particles have been suggested: the plastic particles themselves, the release of persistent organic pollutants adsorbed to the plastics and the leaching of plastic additives.
There has been no evidence of harmful effects to date – however, the precautionary principle would indicate that this is not evidence against taking exposure seriously.
Since microplastics are hydrophobic (insoluble) and are have a high surface-area-to-volume ratio, they can sorb environmental contaminants. If there was a significant accumulation of environmental contaminants, there is the possibility that these concentrations could ‘biomagnify’ up the food chain to higher levels. Biomagnification of PCBs varies by the organism and environmental conditions; multiple studies have shown no evidence of uptake by the organisms of PCBs despite ingestion whilst some mussels, for example, have shown the capability to transfer some compounds into their digestive glands.
To date, there has been no clear evidence of the accumulation of persistent organic pollutants or leached plastic additives in humans. Continued research in this area is important to better understand the role of plastic within broader ecosystems and its risk to human health.
Plastic trade
IN THIS SECTION
- The impact of China’s trade ban
The impact of China’s trade ban
Whilst we looked previously in this entry at the plastic waste generation in countries across the world, it’s also important to understand how plastic waste is traded across the world. Recycled plastic waste is now a product within the global commodity market — it is sold and traded across the world.
This has important implications for managing global plastic waste: if countries with effective waste management systems – predominantly high-income countries – export plastic waste to the middle to low-income countries with poor waste management systems, they could be adding to the ocean plastic problem in this way.
Plastics can be challenging to recycle, particularly if they contain additives and different plastic blends.
The implications of this complexity are two-fold: in many cases, it is convenient for countries to export their recycled plastic waste (meaning they don’t have to handle it domestically); and for importing countries, this plastic is often discarded if it doesn’t meet the sufficient requirements for recycled or is contaminated by non-recyclable plastic. As such, traded plastic waste could eventually enter the ocean through poor waste management systems.
Collectively, China and Hong Kong have imported 72.4 percent of global traded plastic waste (with most imports to Hong Kong eventually reaching China).
This came to an end in 2017. At the end of that year, China introduced a complete ban on the imports of non-industrial plastic waste.
How much plastic waste did China import?
In the chart, we see the quantity of plastic waste China had to manage over the period from 2010 to 2016. This is differentiated by domestic plastic waste generation, shown in grey, and imported plastic waste shown in red. The total plastic waste to manage is equal to the sum of domestic and imported plastic waste.
Over this period, China imported between 7 and 9 million tonnes of plastic waste per year. In 2016, this figure was 7.35 million tonnes. To put this in context, China’s domestic plastic waste generation was around 61 million tonnes. Therefore, 10-11 percent of China’s total plastic waste was imported from around the world.
Who were the main plastic exporters to China?
Which countries export the most plastic waste to China? In the chart, we see the quantity of plastic exported to China from the top 10 exporting countries. Collectively, these countries are responsible for around 76 percent of their imports.
As we see, Hong Kong typically acts as an entry point for Chinese imports; it is, therefore, the largest ‘exporting’ country to China. Many high-income countries are included in this top 10: Japan, the USA, Germany, Belgium, Australia and Canada are all major plastic exporters.
How much plastic will be displaced from the Chinese import ban?
Chinese import ban?
China has been increasing restrictions on its plastic waste imports since 2007. In 2010, it implemented its “Green Fence” program – a temporary restriction for plastic imports with significantly less contamination.
In 2017 it implemented a much stricter, permanent ban on non-industrial plastic imports. In the chart, we see the estimated impact on the cumulative displacement of global plastic waste to 2030 as a result of the Chinese import ban. This is shown for three scenarios: assuming the maintained 100 percent import ban, in addition to the impact of this was reduced to 75 or 50 percent.
By 2030, it’s estimated that around 110 million tonnes of plastic will be displaced as a result of the ban. This plastic waste will have to be handled domestically or exported to another country. Brooks et al. (2018) suggest this ban has several implications:
- exporting countries can use this as an opportunity to improve domestic recycled infrastructure and generate internal markets;
- if recycling infrastructure is lacking, this provides further incentive for countries to reduce primary plastic production (and create more circular material models) to reduce the quantity of waste which needs to be handled;
- it fundamentally changes the nature of global plastic trade, representing an opportunity to share and promote best practices of waste management, and harmonize technical standards on waste protocols;
- some other countries may attempt to become a key plastic importer in place of China; one challenge is that many countries do not yet have sufficient waste management infrastructure to handle recycled waste imports;
- countries considering importing significant quantities of plastic waste could consider an import tax specifically aimed at funding the development of sufficient infrastructure to handle such waste.
What determines how much plastic waste we produce?
In the chart, we show the plastic waste generate rate per person versus gross domestic product (GDP) per capita. In general — although there is significant variation across countries at all levels of development — plastic waste generation tends to increase as we get richer. Per capita, plastic waste at low incomes tends to be notably smaller.
What determines how much mismanaged waste we produce?
Whilst per capita plastic waste generation tends to increase with income (see above), this general relationship does not hold when we consider mismanaged plastic waste.
In the chart, we show the mismanaged per capita plastic waste generation rate versus GDP per capita.
Here we see an inverse-U curve pattern. Mismanaged waste generation tends to be low at very low incomes (since per capita waste is small); it then rises towards middle incomes; and then falls again at higher incomes.
Countries around the middle of the global income spectrum, therefore, tend to have the highest per capita mismanaged plastic rates.
This has typically occurred in countries that have rapidly industrialized but failed to make progress in waste management at the same speed.
The development of effective waste management infrastructure, particularly in middle-income countries, is, therefore, crucial to making progress against plastic pollution.
Countries with large coastal populations also have larger amounts of mismanaged plastics
It is also the case that countries with high levels of mismanaged waste also have large coastal populations (as shown in the chart). This exacerbates the challenge of ocean plastic pollution because poorly-managed waste is at high risk of entering the ocean.
Additional FAQs on Plastics
In addition to this main data entry, we have collated some of the most common questions on plastics on our FAQ on the Plastics page. You may find the answer to additional questions on this topic there.
Data Quality & DefinitionsIN THIS SECTION
- Data Definitions
- Plastic particles size categories
Data Definitions
The definitions of key terms used in this entry are as follows:
Discarded: waste that is not recycled or incinerated; this includes waste that goes to a landfill (closed or open), is littered, or lost to the natural environment.
Incineration: a method of waste treatment that involves the burning of material at very high temperatures. In some cases, energy recovery from the incineration process is possible. The burning of plastics can release toxins to the air and surrounding environment and should therefore be carried out under controlled and regulated conditions.
Inadequately managed waste: waste is not formally managed and includes disposal in dumps or open, uncontrolled landfills, where it is not fully contained. Inadequately managed waste has a high risk of polluting rivers and oceans. This does not include ‘littered’ plastic waste, which is approximately 2% of total waste (including high-income countries).
Mismanaged waste: material that is either littered or inadequately disposed of (the sum of littered and inadequately disposed waste). Inadequately disposed waste is not formally managed and includes disposal in dumps or open, uncontrolled landfills, where it is not fully contained. Mismanaged waste could eventually enter the ocean via inland waterways, wastewater outflows, and transport by wind or tides.
Plastic particles size categories
Plastic particles are typically grouped into categories depending on their size (as measured by their diameter). The table summarizes some standard ranges for a given particle category.
| Particle category | Diameter range (mm = millimetres) |
| Nanoplastics | < 0.0001 mm (0.1μm) |
| Small microplastics | 0.00001 – 1 mm |
| Large microplastics | 1 – 4.75 mm |
| Mesoplastics | 4.76 – 200 mm |
| Macroplastics | >200 mm |
Data Sources
Jambeck et al. (2015). Plastic waste inputs from land into the ocean.
- Data: Plastic waste generation rate, mismanaged waste and plastics entering the ocean
- Geographical coverage: Global by country
- Timespan: Estimates for 2010 and projections for 2025
- Available at: http://science.sciencemag.org/content/347/6223/768
Geyer, R., Jambeck, J. R., & Law, K. L. (2017). Production, use, and the fate of all plastics ever made.
- Data: Plastic production, by sector and polymer type; and fate of plastics
- Geographical coverage: Global
- Timespan: 1950-2015
- Available at: http://advances.sciencemag.org/content/3/7/e1700782
Eriksen et al. (2014). Plastic pollution in the world’s oceans: more than 5 trillion plastic pieces weighing over 250,000 tons afloat at sea.
- Data: Estimates of plastics floating in surface oceans
- Geographical coverage: Global, by ocean
- Timespan: 2013
- Available at: http://journals.plos.org/plosone/article?id=10.1371/journal.pone.0111913
Lebreton et al. (2018). Evidence that the Great Pacific Garbage Patch is rapidly accumulating plastic.
- Data: Estimates of plastic accumulative in the Great Pacific Garbage Patch
- Geographical coverage: Pacific Ocean
- Available at: https://www.nature.com/articles/s41598-018-22939-w