
Summary
- Wild mammal biomass has declined by 85% since the rise of human civilizations. This was mainly driven by overhunting and habitat loss.
- Wild animals only make up 4% of the world’s mammals; humans account for 34%, and our livestock for 62%.
- More than 178 of the world’s largest species went extinct during the Quaternary Extinction. Overhunting was likely the main driver.
- The tropics are home to the most unique mammal species.
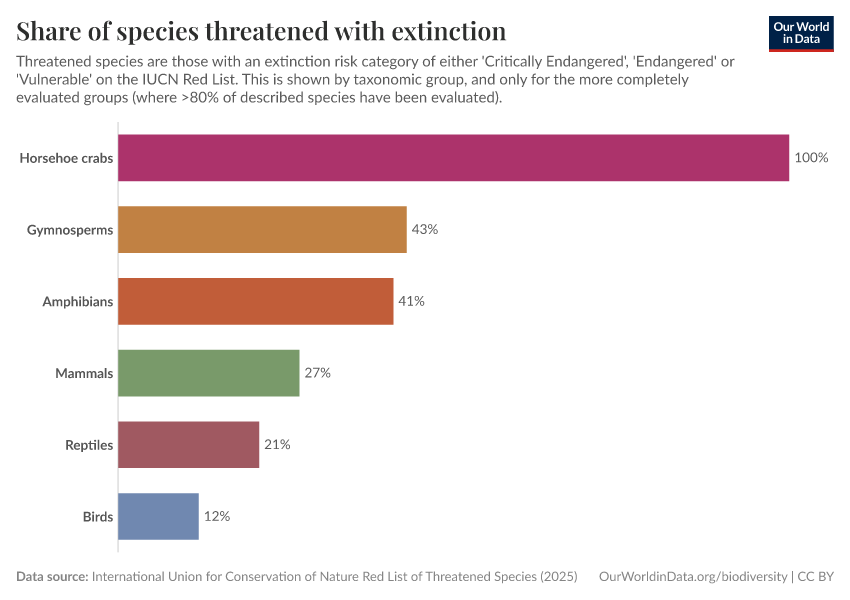
- One-quarter of the world’s mammal species are threatened with extinction. Most are in the tropics.
- It is the largest mammals that are at the greatest risk of extinction. Most due to overhunting and poaching.
- Poaching has led to a dramatic decline in elephant populations. All species are now critically endangered or endangered with extinction.
- The status of rhino populations is mixed: the Southern White rhino has seen a significant recovery, but the Northern White, Black, Javan, Indian and Sumatran rhinos are all endangered.
- Over the early 20th century, whaling led to a two-thirds decline in whale populations. But whaling rates have seen a dramatic decline in recent decades allowing some populations to begin recovery.
Wild mammal biomass has declined by 85% since the rise of humans, but there is a possible future where they flourish.
Travel back 100,000 years and the planet was rich with a wide array of wild mammals. Mammoths roamed across North America; lions across Europe; 200-kilogram wombats in Australasia; and the ground sloth lounged around South America.
They’re now gone. Since the rise of humans, several hundred of the world’s largest mammals have gone extinct.
While we often think of ecological damage as a modern problem our impacts date back millennia to the times in which humans lived as hunter-gatherers. Our history with wild animals has been a zero-sum game: either we hunted them to extinction, or we destroyed their habitats with agricultural land. Without these natural habitats to expand into and produce food on, the rise of humans would have been impossible. Humans could only thrive at the expense of wild mammals.
But it doesn’t have to be this way. This century marks a pivotal moment: for the first time in human history, there is the opportunity for us to thrive alongside, rather than compete with, the other mammals that we share this planet with.
In this article, I want to take a look at how the world’s mammals have changed in the past, and how we can pave a better way forward.
As we’ll see, our long history with the other mammals is really a story about meat. Humans have always, and continue to have, a strong drive to eat meat. For our hunter-gatherer ancestors life was about plotting a hunt against the giant 200-kilogram wombat. This later became a story of how to produce the equivalent of a giant wombat in the field. Now we’re focused on how we can produce this in the lab.
The decline of wild mammals has a long history
To understand how the richness of the mammal kingdom has changed we need a metric that captures a range of different animals and is comparable over time. We could look at their abundance – the number of individuals we have – but this is not ideal. We would be counting every species equally, from a mouse to an elephant and this metric would therefore an ecosystem taken over by the smallest mammals look much richer than one in which bigger mammals roam: if the world’s mouse populations multiplied and multiplied – maybe even to the detriment of other animals – then this abundance metric might suggest that these ecosystems were thriving.
Instead, ecologists often use the metric biomass. This means that each animal is measured in tones of carbon, the fundamental building block of life.1 Biomass gives us a measure of the total biological productivity of an ecosystem. It also gives more weight to larger animals at higher levels of the ecological ‘pyramid’: these rely on well-functioning bases below them.
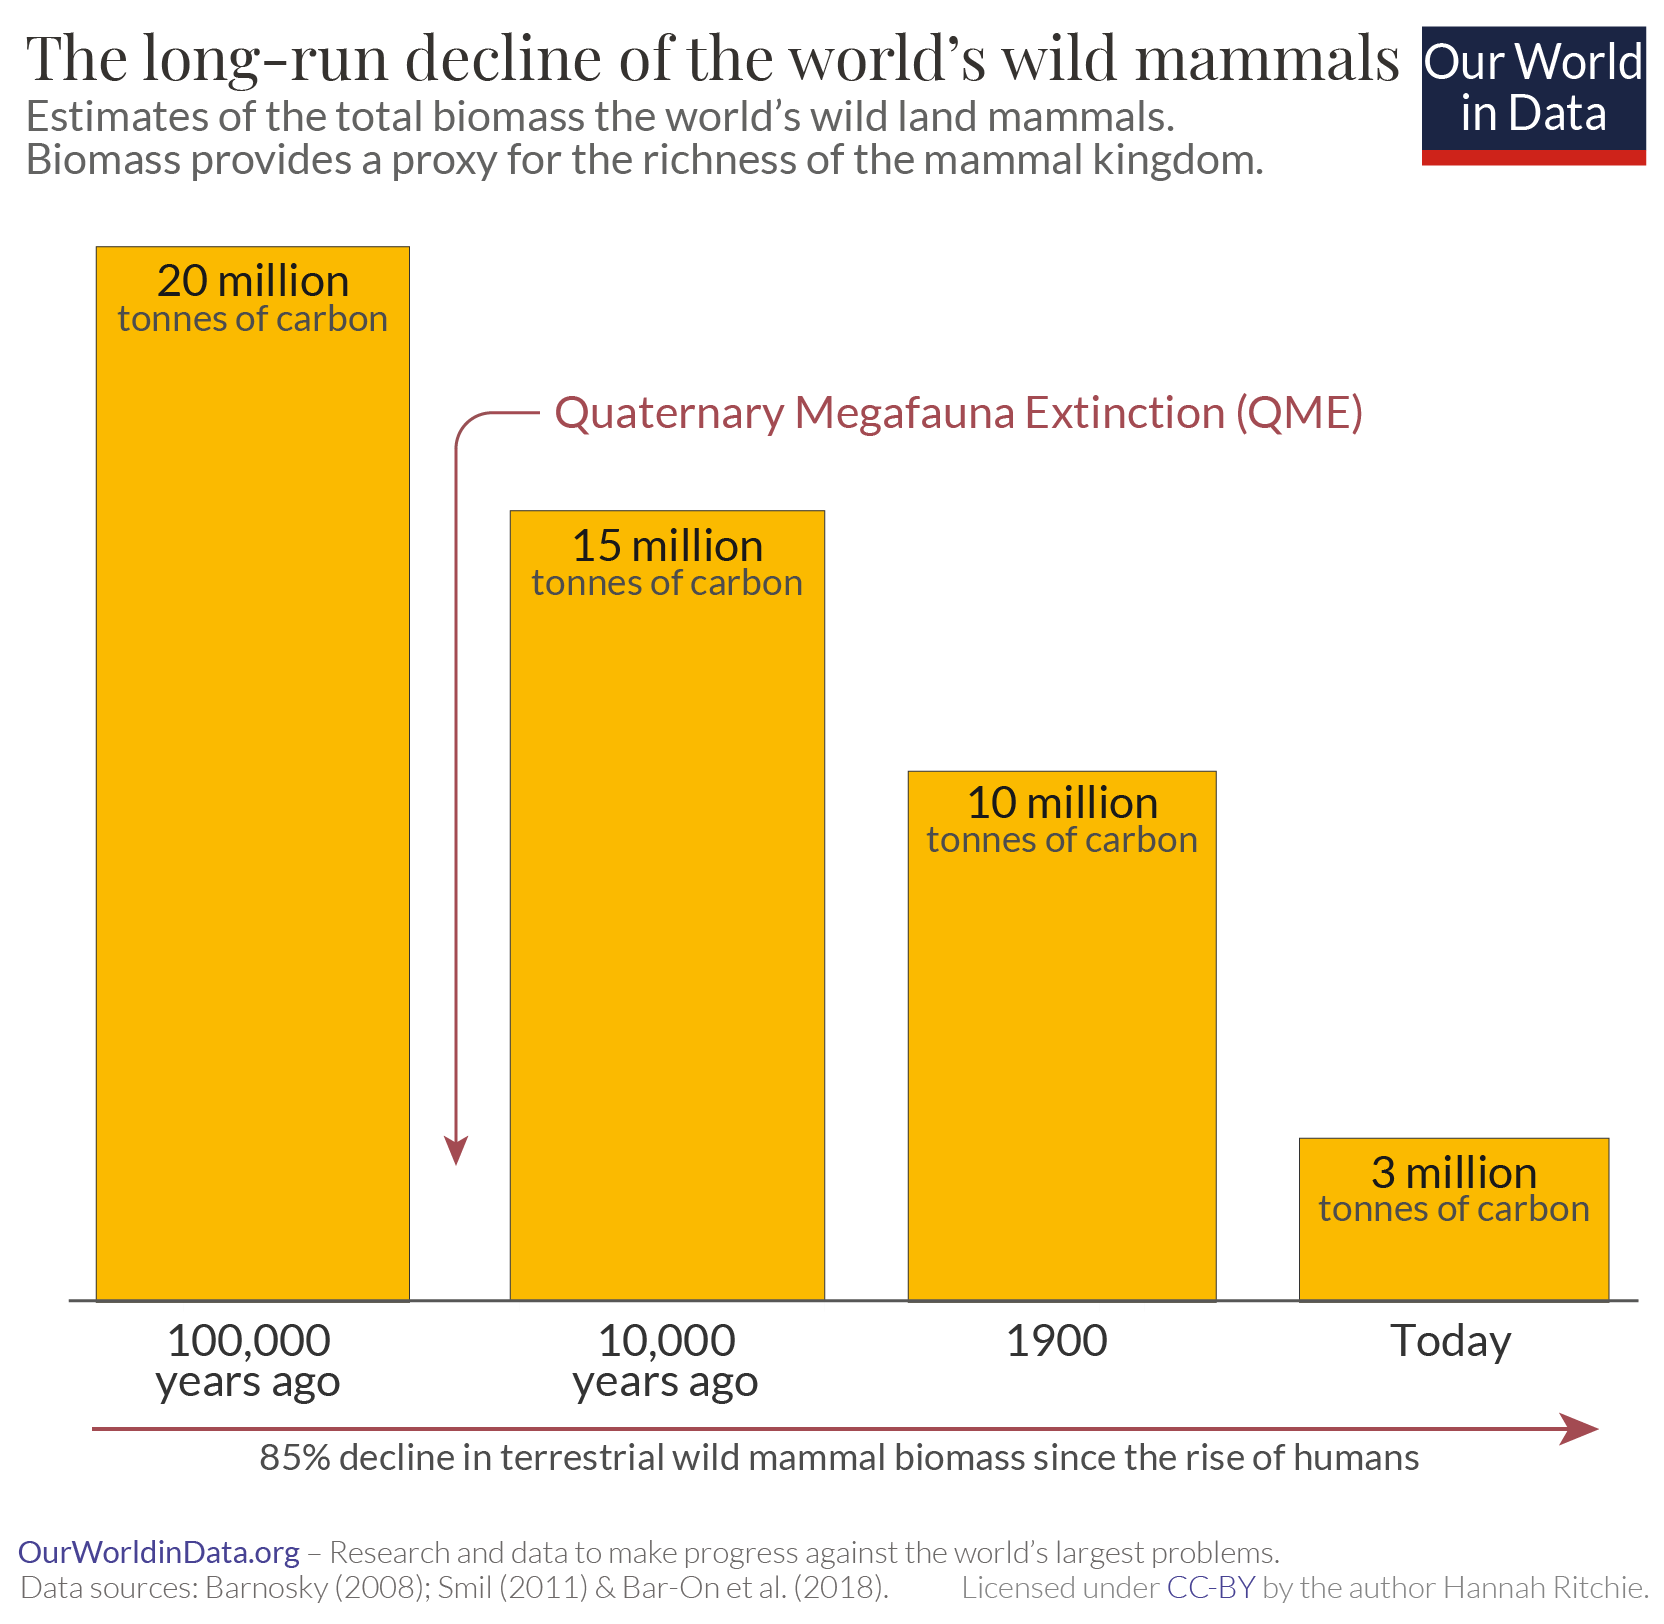
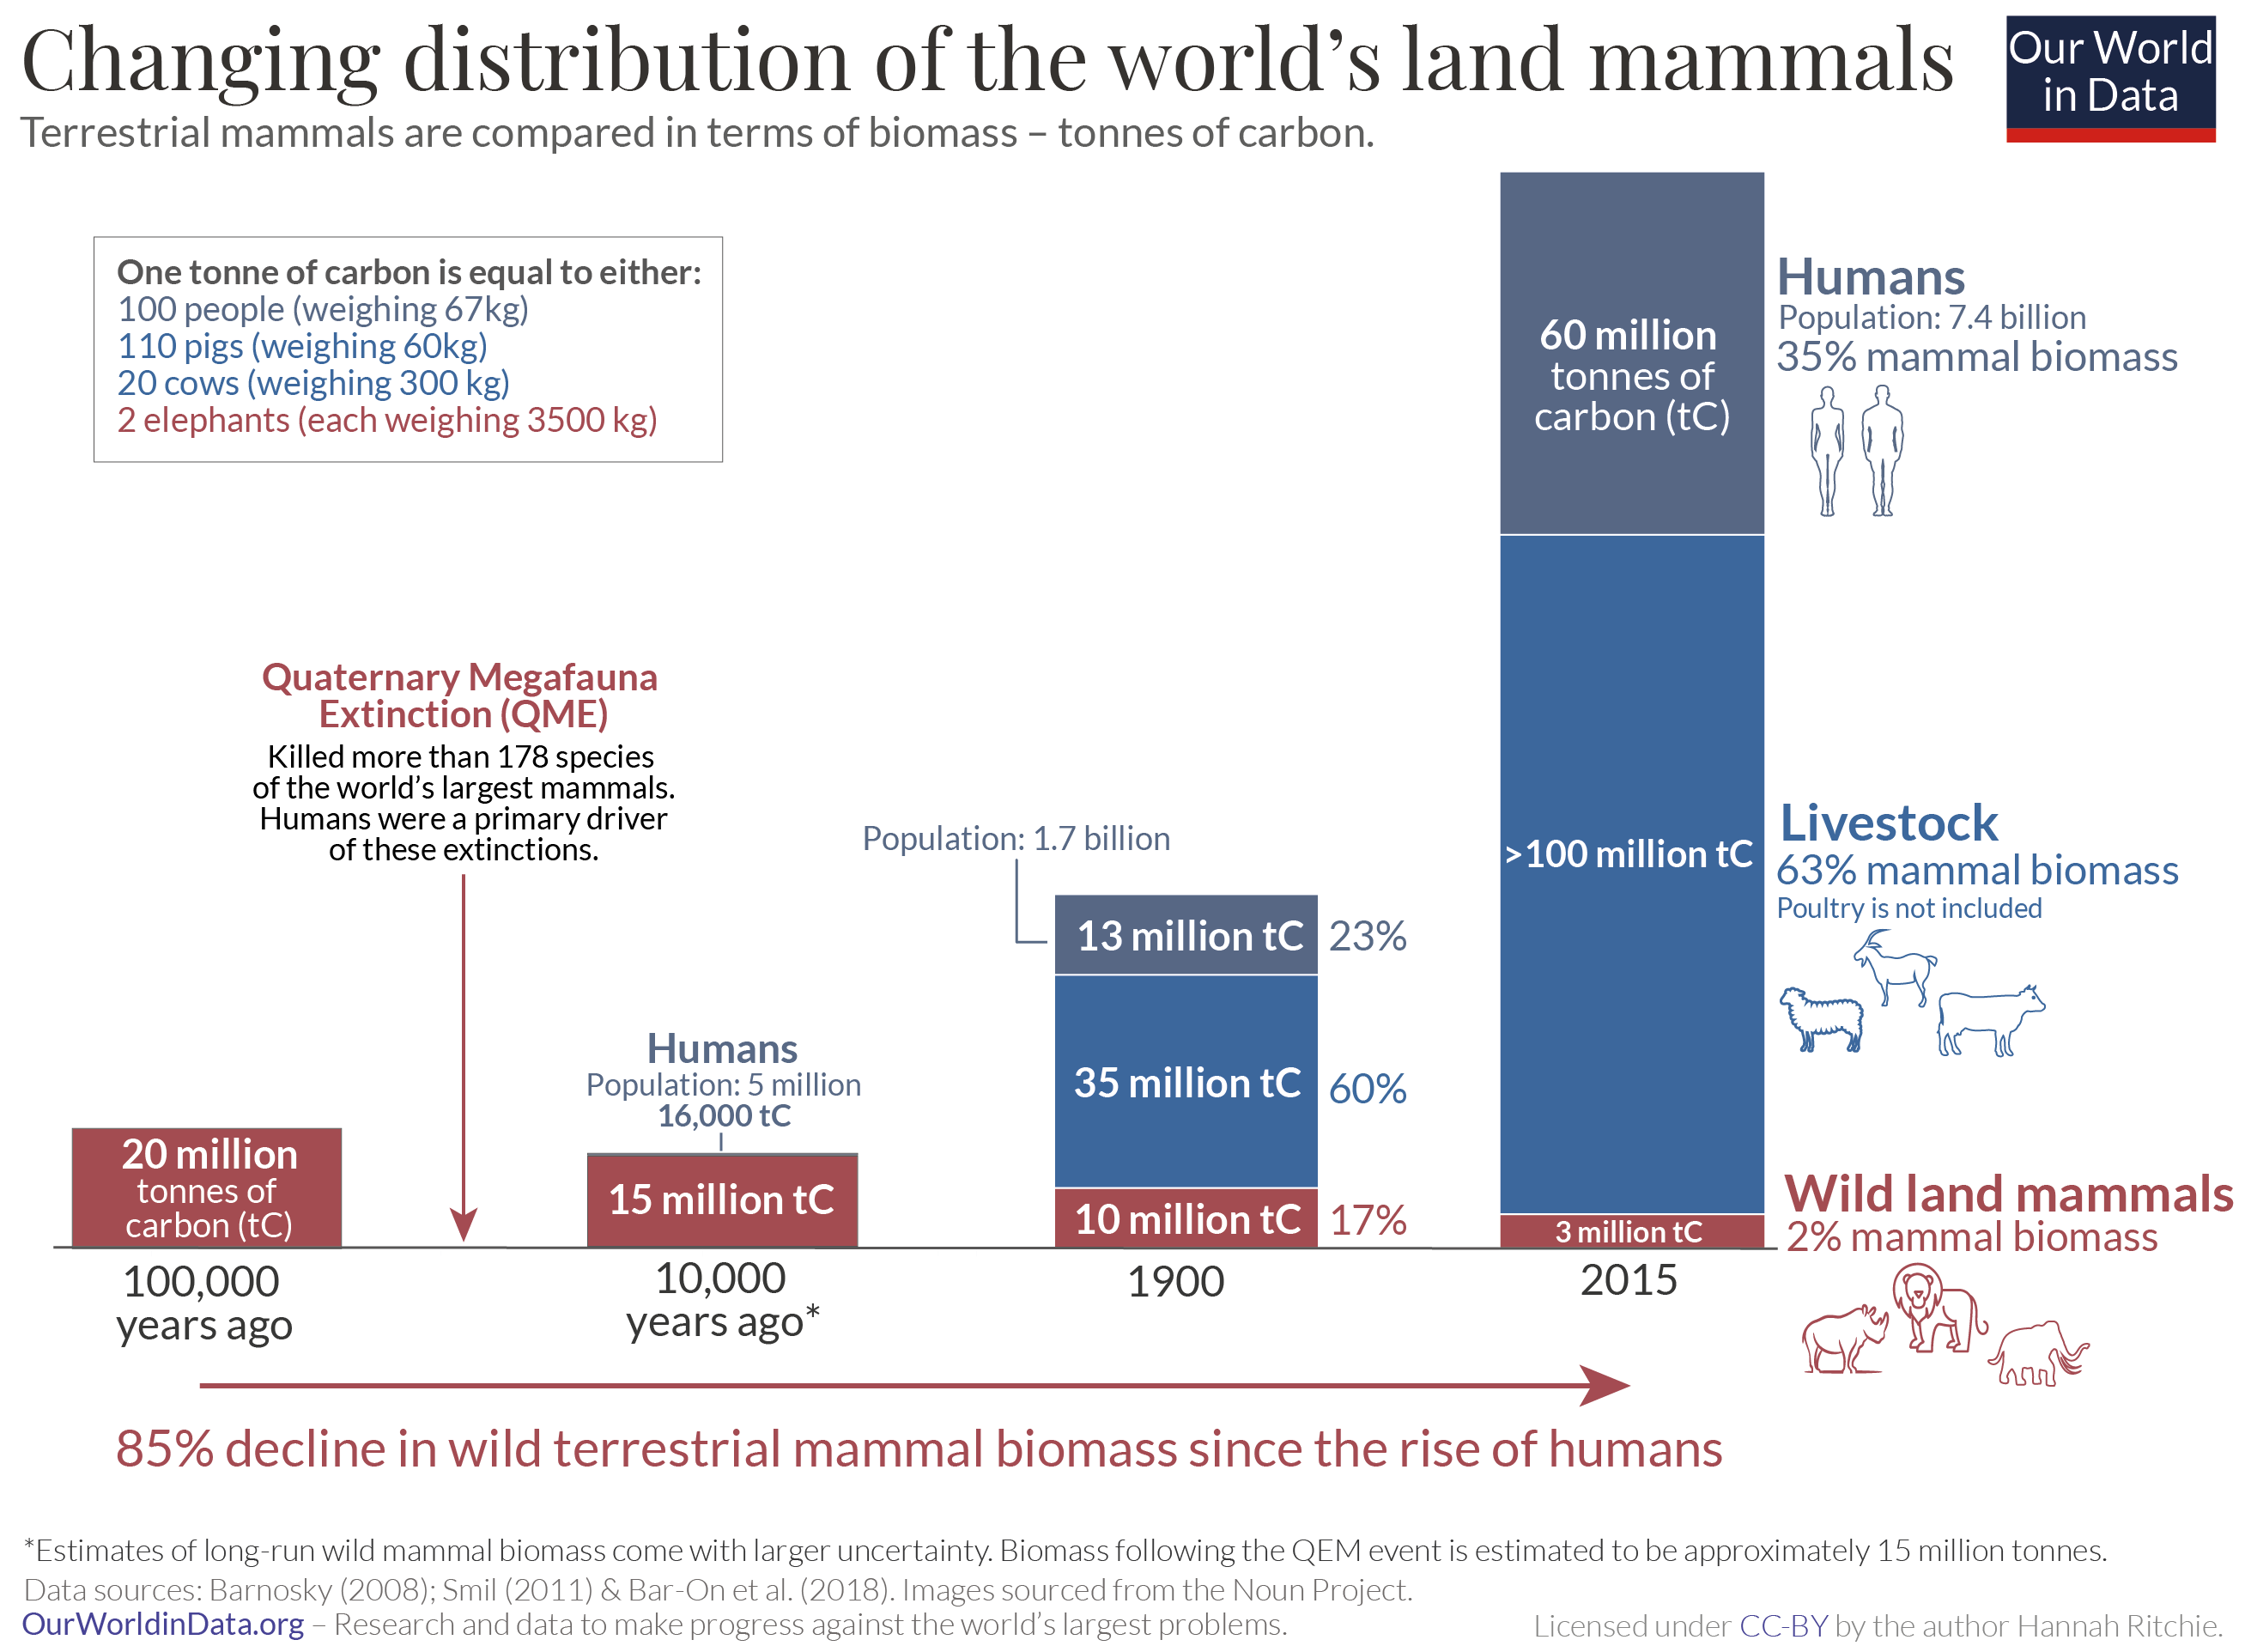
I have reconstructed the long-term estimates of mammal terrestrial biomass from 100,000 BC through to today from various scientific sources.2. This means biomass from marine mammals – mainly whales – is not included. The story of whaling is an important one that I cover separately here. This change in wildland mammals is shown in the chart. When I say ‘wild mammals’ from this point, I’m talking about our metric of biomass.
If we go back to around 100,000 years ago – a time when there were very few early humans and only in Africa – all of the wildland mammals on Earth summed up to around 20 million tones of carbon. This is shown as the first column in the chart. The mammoths, and European lions, and ground sloths were all part of this.
By around 10,000 years ago we see a huge decline of wild mammals. This is shown in the second column. It’s hard to give a precise estimate of the size of these losses millennia ago, but they were large: likely in the range of 25% to 50%.3
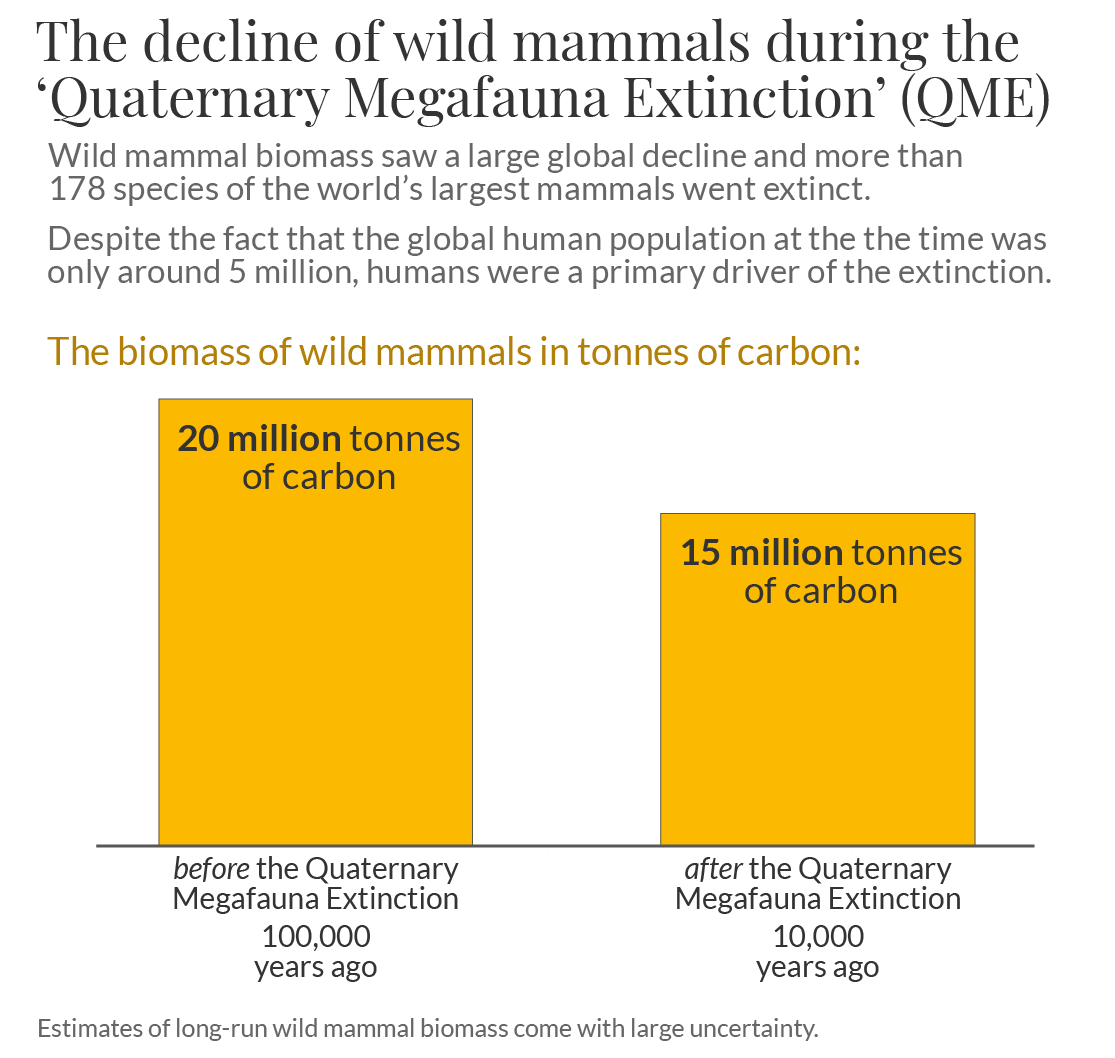
It wasn’t just that we lost a lot of mammals. It was almost exclusively the world’s largest mammals that vanished. This big decline of mammals is referred to as the Quaternary Megafauna Extinction (QME). The QME led to the extinction of more than 178 of the world’s large mammals (‘megafauna’).
Many researchers have grappled with the question of what caused the QME. Most evidence now points towards humans as the primary driver.4 I look at this evidence in much more detail in a related article. Most of this human impact came through hunting. There might also have been smaller local impacts through fire and other changes to natural landscapes. You can trace the timing of mammal extinctions by following human expansion across the world’s continents. When our ancestors arrived in Europe the European megafauna went extinct; when they arrived in North America the mammoths went extinct; then down to South America, the same.
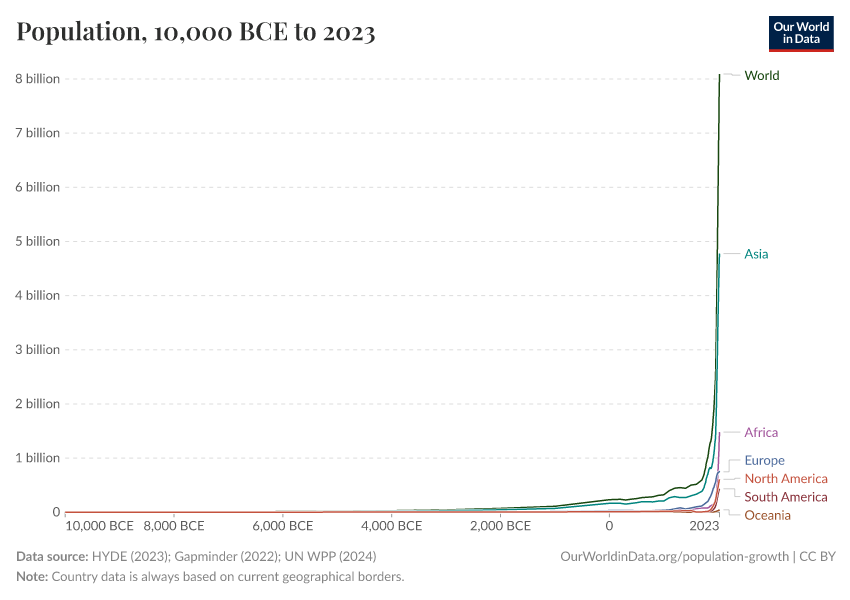
What’s most shocking is how few humans were responsible for this large-scale destruction of wildlife. There were likely fewer than 5 million people in the world.5 Around half the population of London today.6
A global population half the size of London helped drive tens to hundreds of the world’s largest mammals to extinction. The per capita impact of our hunter-gatherer ancestors was huge.
The romantic idea that our hunter-gatherer ancestors lived in harmony with nature is deeply flawed. Humans have never been ‘in balance’ with nature. Trace the footsteps of these tiny populations of the past and you will find extinction after extinction after extinction.
Hunting to farming: how human populations now compete with wild mammals
We’re now going to fast-forward to our more recent past. By the year 1900, wild mammals had seen another large decline.

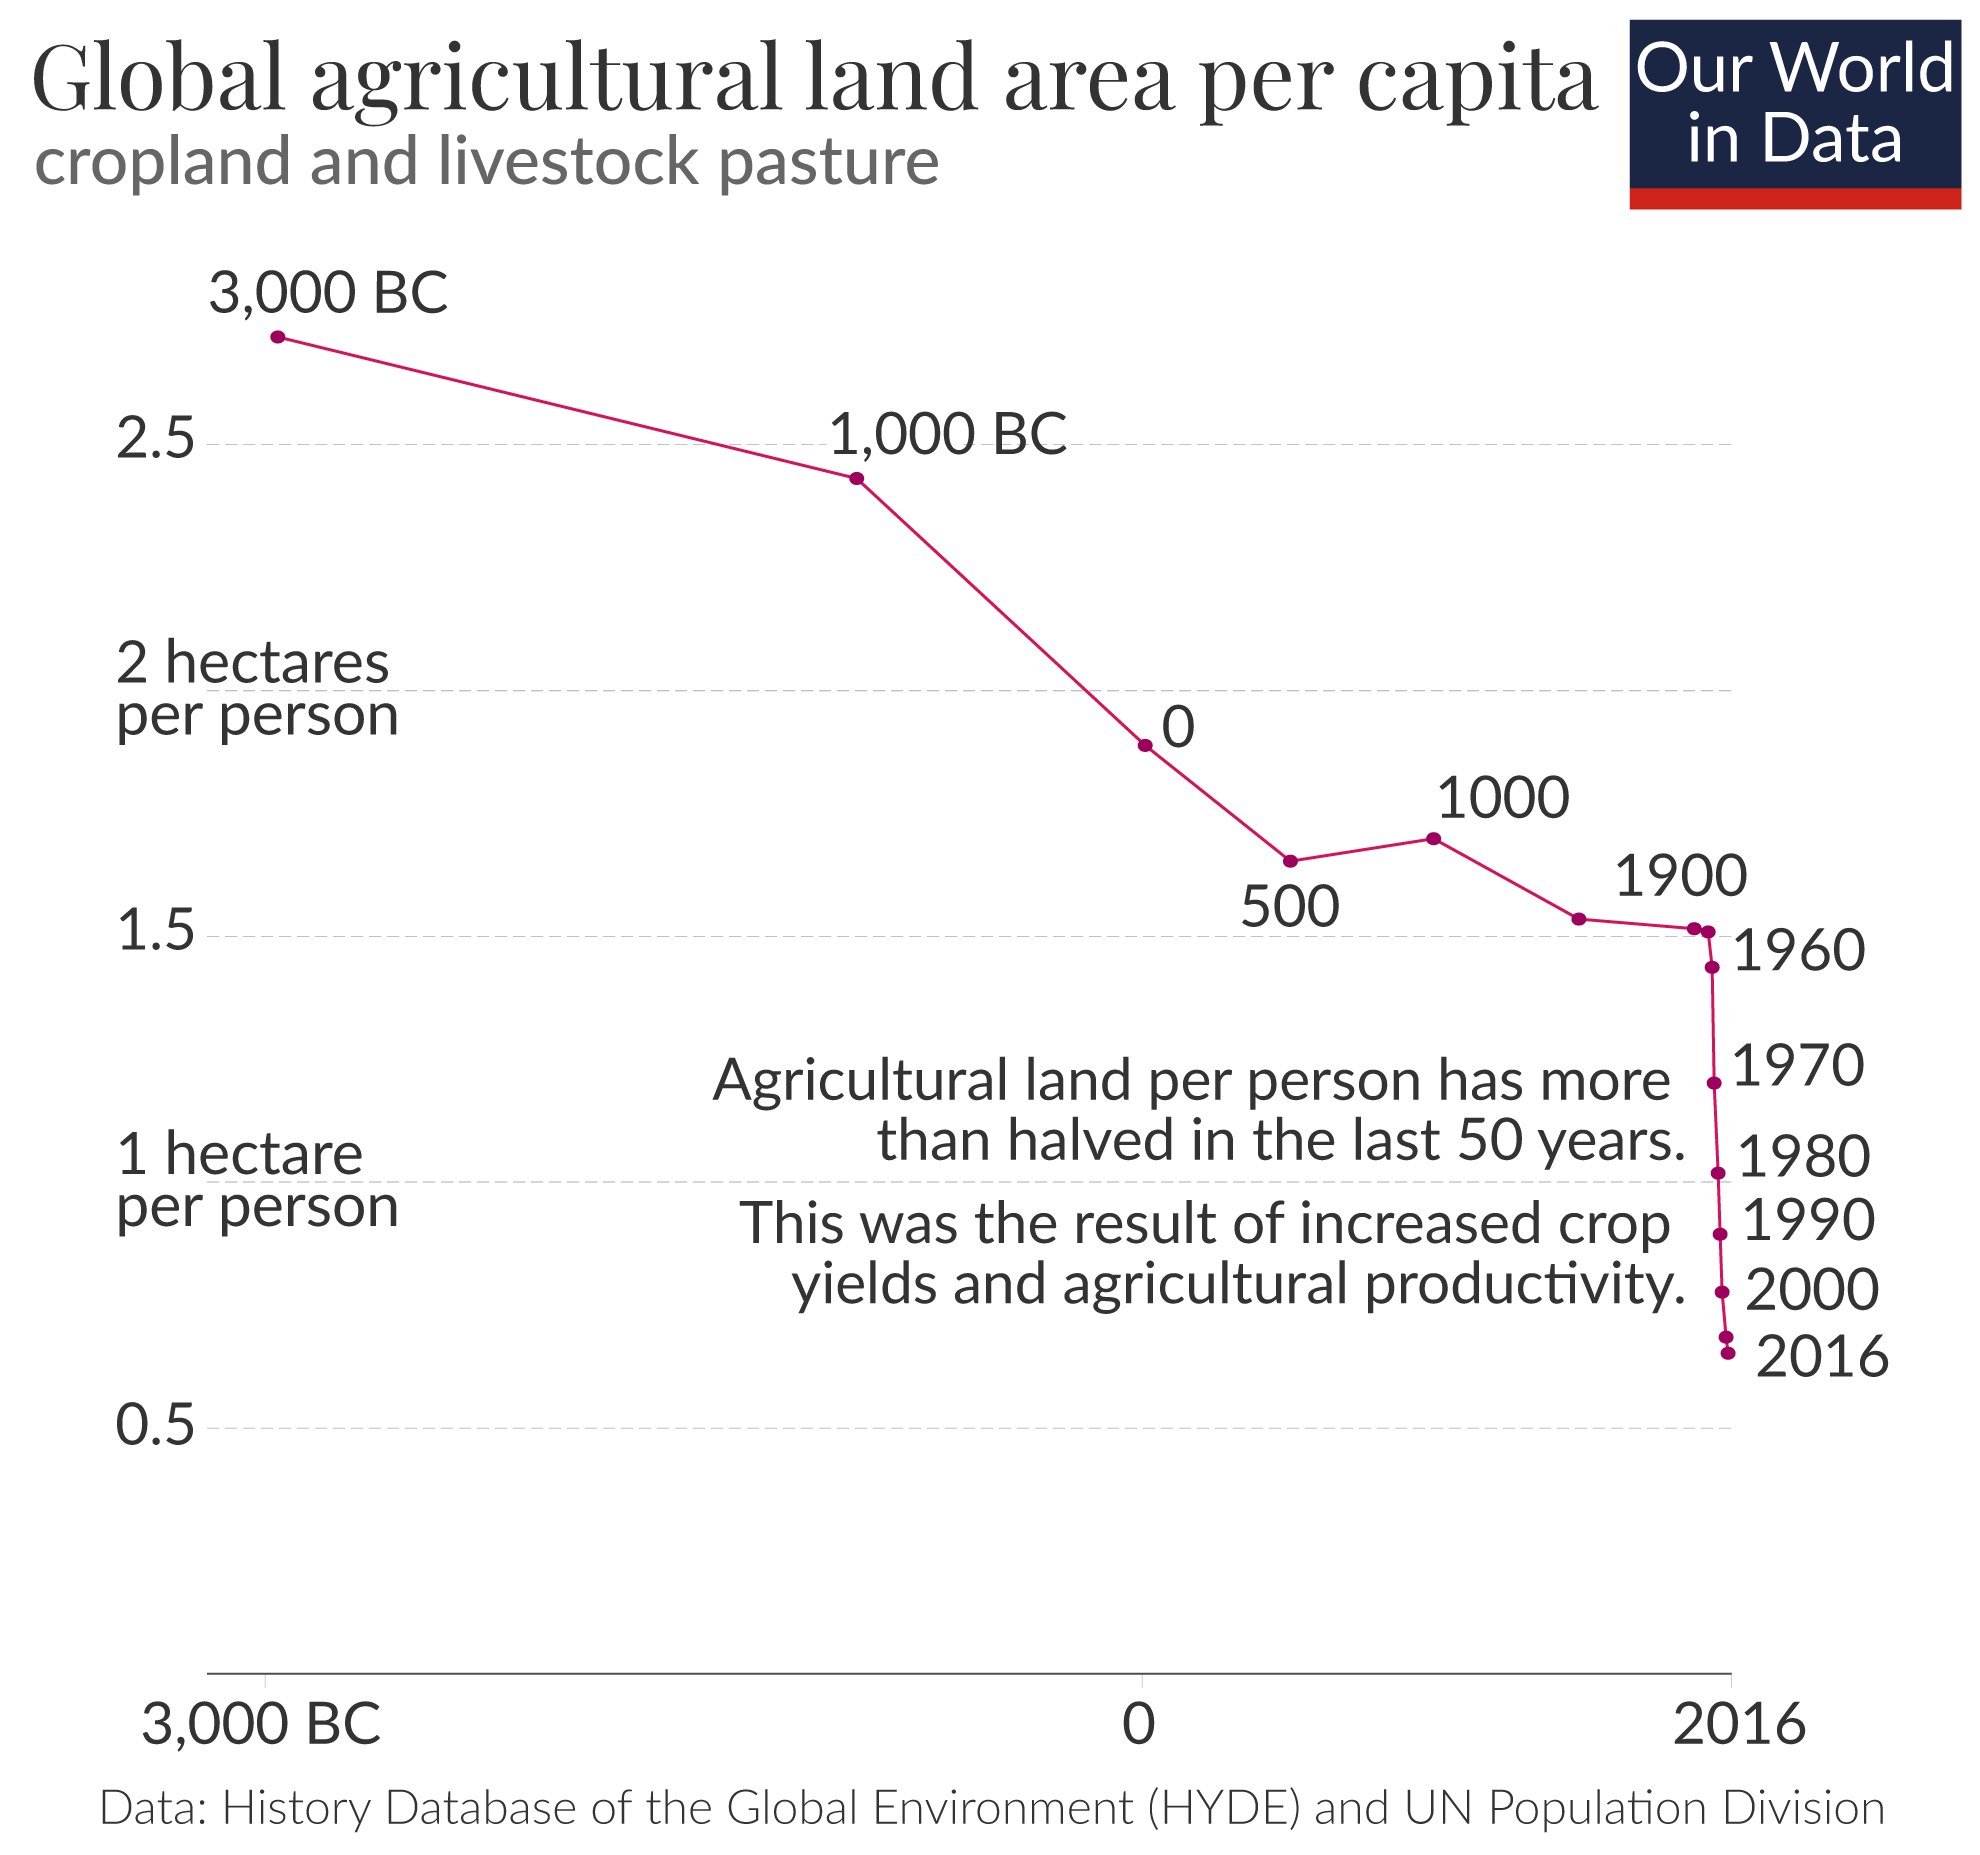
By this point, the pressures on wild mammals had shifted. The human population had increased to 1.7 billion people. But the most important change was the introduction of farming and livestock. We see this in the top panel of the chart. This shows the per capita agricultural land use over these millennia – a reflection of how humans got their food.7 Before the agricultural revolution around 10,000 years ago, our food came from hunting and gathering. Agricultural land use was minimal although as we’ve already seen, per capita impacts were still high through hunting. We then see a clear transition point, where agricultural land use begins to rise.
The rise of agriculture had both upsides and downsides for wild mammals. On the one hand, it alleviated some of the direct pressure. Rather than hunting wild mammals we raised our own for meat, milk, or textiles. In this way, the rise of livestock saved wildlife. Crop farming also played a large role in this. The more food humans could produce for themselves, the less they needed to rely on wild meat.
But the rise of agriculture also had a massive downside: the need for agricultural land meant the loss of wild habitats.
The expansion of agriculture over millennia has completely reshaped the global landscape from one of wild habitats, to one dominated by farms. Over the last 10,000 years, we’ve lost one-third of the world’s forests and many grasslands and other wild habitats have been lost too. This obviously came at a large ecological cost: rather than competing with wild mammals directly, our ancestors took over the land that they needed to survive.

We see this change clearly in the bottom panel of the chart: there was a first stage of wild mammal loss through hunting; then another decline through the loss of habitats to farmland.
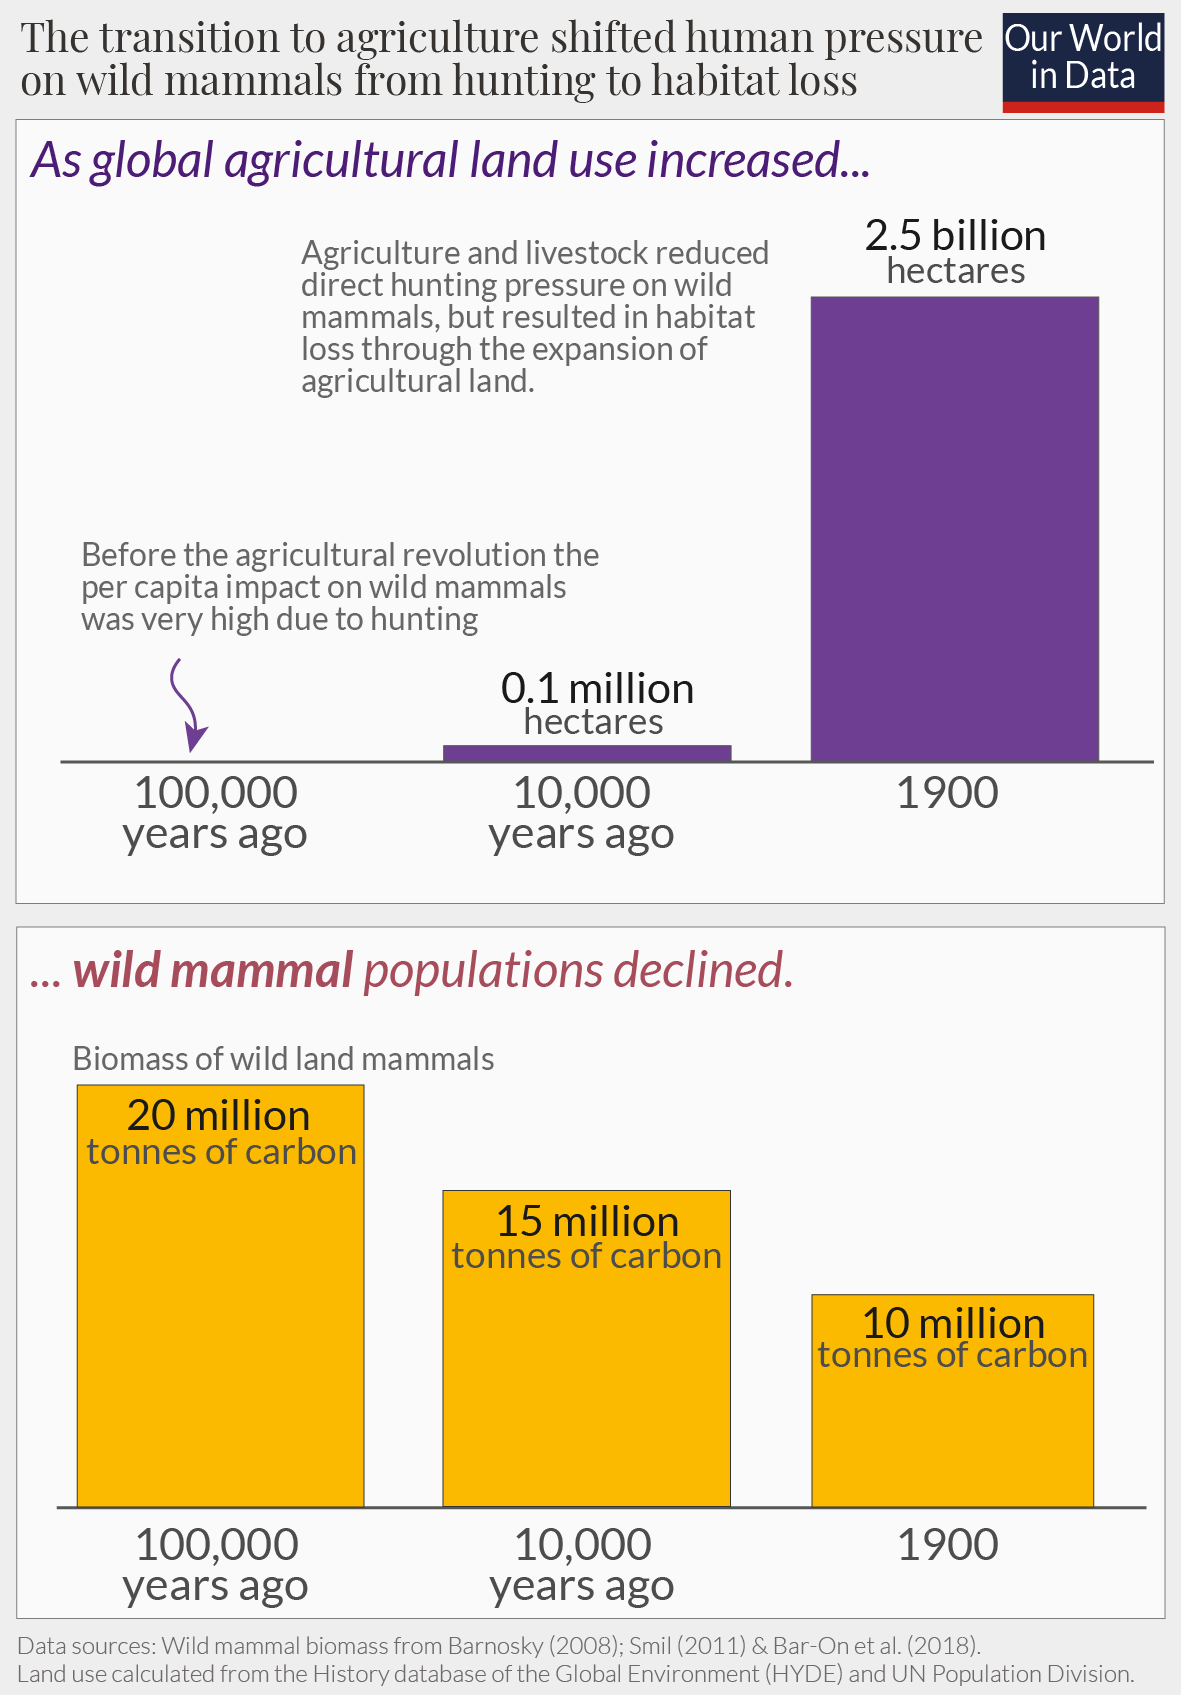
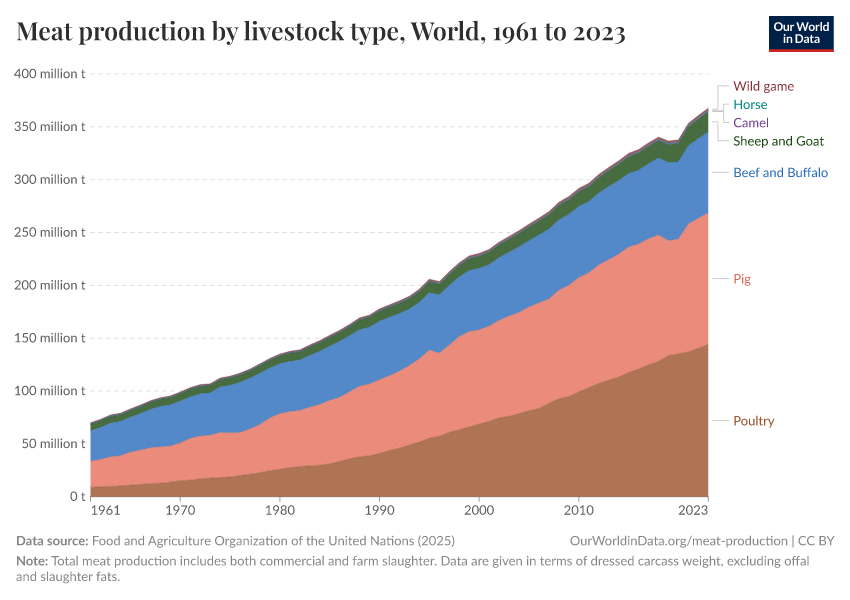
This shift in the distribution has continued through to today. We see this in the final column, which gives the breakdown in 2015. Wild mammals saw another large decline in the last century. At the same time the human population increased, and our livestock even more so.
This is because incomes across the world have increased, meaning more people can afford the meat products that were previously unavailable to them. We dig a bit deeper into this distribution of mammals in a related article.
The past was a zero-sum game; the future doesn’t have to be
Since the rise of humans, wildland mammals have declined by 85%.
As we just saw, this history can be divided into two stages. The pre-agriculture phase where our ancestors were in direct competition with wild mammals. They killed them for their meat. And the post-agriculture phase where the biggest impact was indirect: habitat loss through the expansion of farmland. Our past relationship with wild animals has been a zero-sum game: in one way or another, human success has come at the cost of wild animals.
How do we move forward?
Some people suggest a return to wild hunting as an alternative to modern, intensive farming. A return to our primal roots. This might be sustainable for a few local communities. But we only need to do a simple calculation to see how unfeasible this is at any larger scale. In 2018 the world consumed 210 million tonnes of livestock meat from mammals [we’re only looking at mammals here so I’ve excluded chicken, turkey, goose, and duck meat]. In biomass terms, that’s 31 million tonnes of carbon.8 From our chart above we saw that there are only 3 million tonnes of wildland mammal biomass left in the world. If we relied on this for food, all of the world’s wild mammals would be eaten within a month.9
We cannot go back to this hunter-gatherer way of living. Even a tiny number of people living this lifestyle had a massive negative impact on wildlife. For a population of almost 8 billion, it’s simply not an option.
But the alternative of continued growth in livestock consumption is also not sustainable. In the short term, it is saving some wild mammals from hunting. But its environmental costs are high: the expansion of agricultural land is the leading driver of deforestation, it emits large amounts of greenhouse gases, and needs lots of resource inputs.

Thankfully we have options to build a better future. If we can reduce agricultural land – and primarily land use for livestock – we can free up land for wild mammals to return. There are already positive signs that this is possible. In the chart, we see the change in per capita agricultural land use from 5,000 years ago to today.10 Land use per person has fallen four-fold. The most dramatic decline has happened in the last 50 years: the amount of agricultural land per person has more than halved since 1960. This was the result of increased crop yields and livestock productivity. Of course, the world population also increased over that time, meaning total agricultural land use continued to grow.
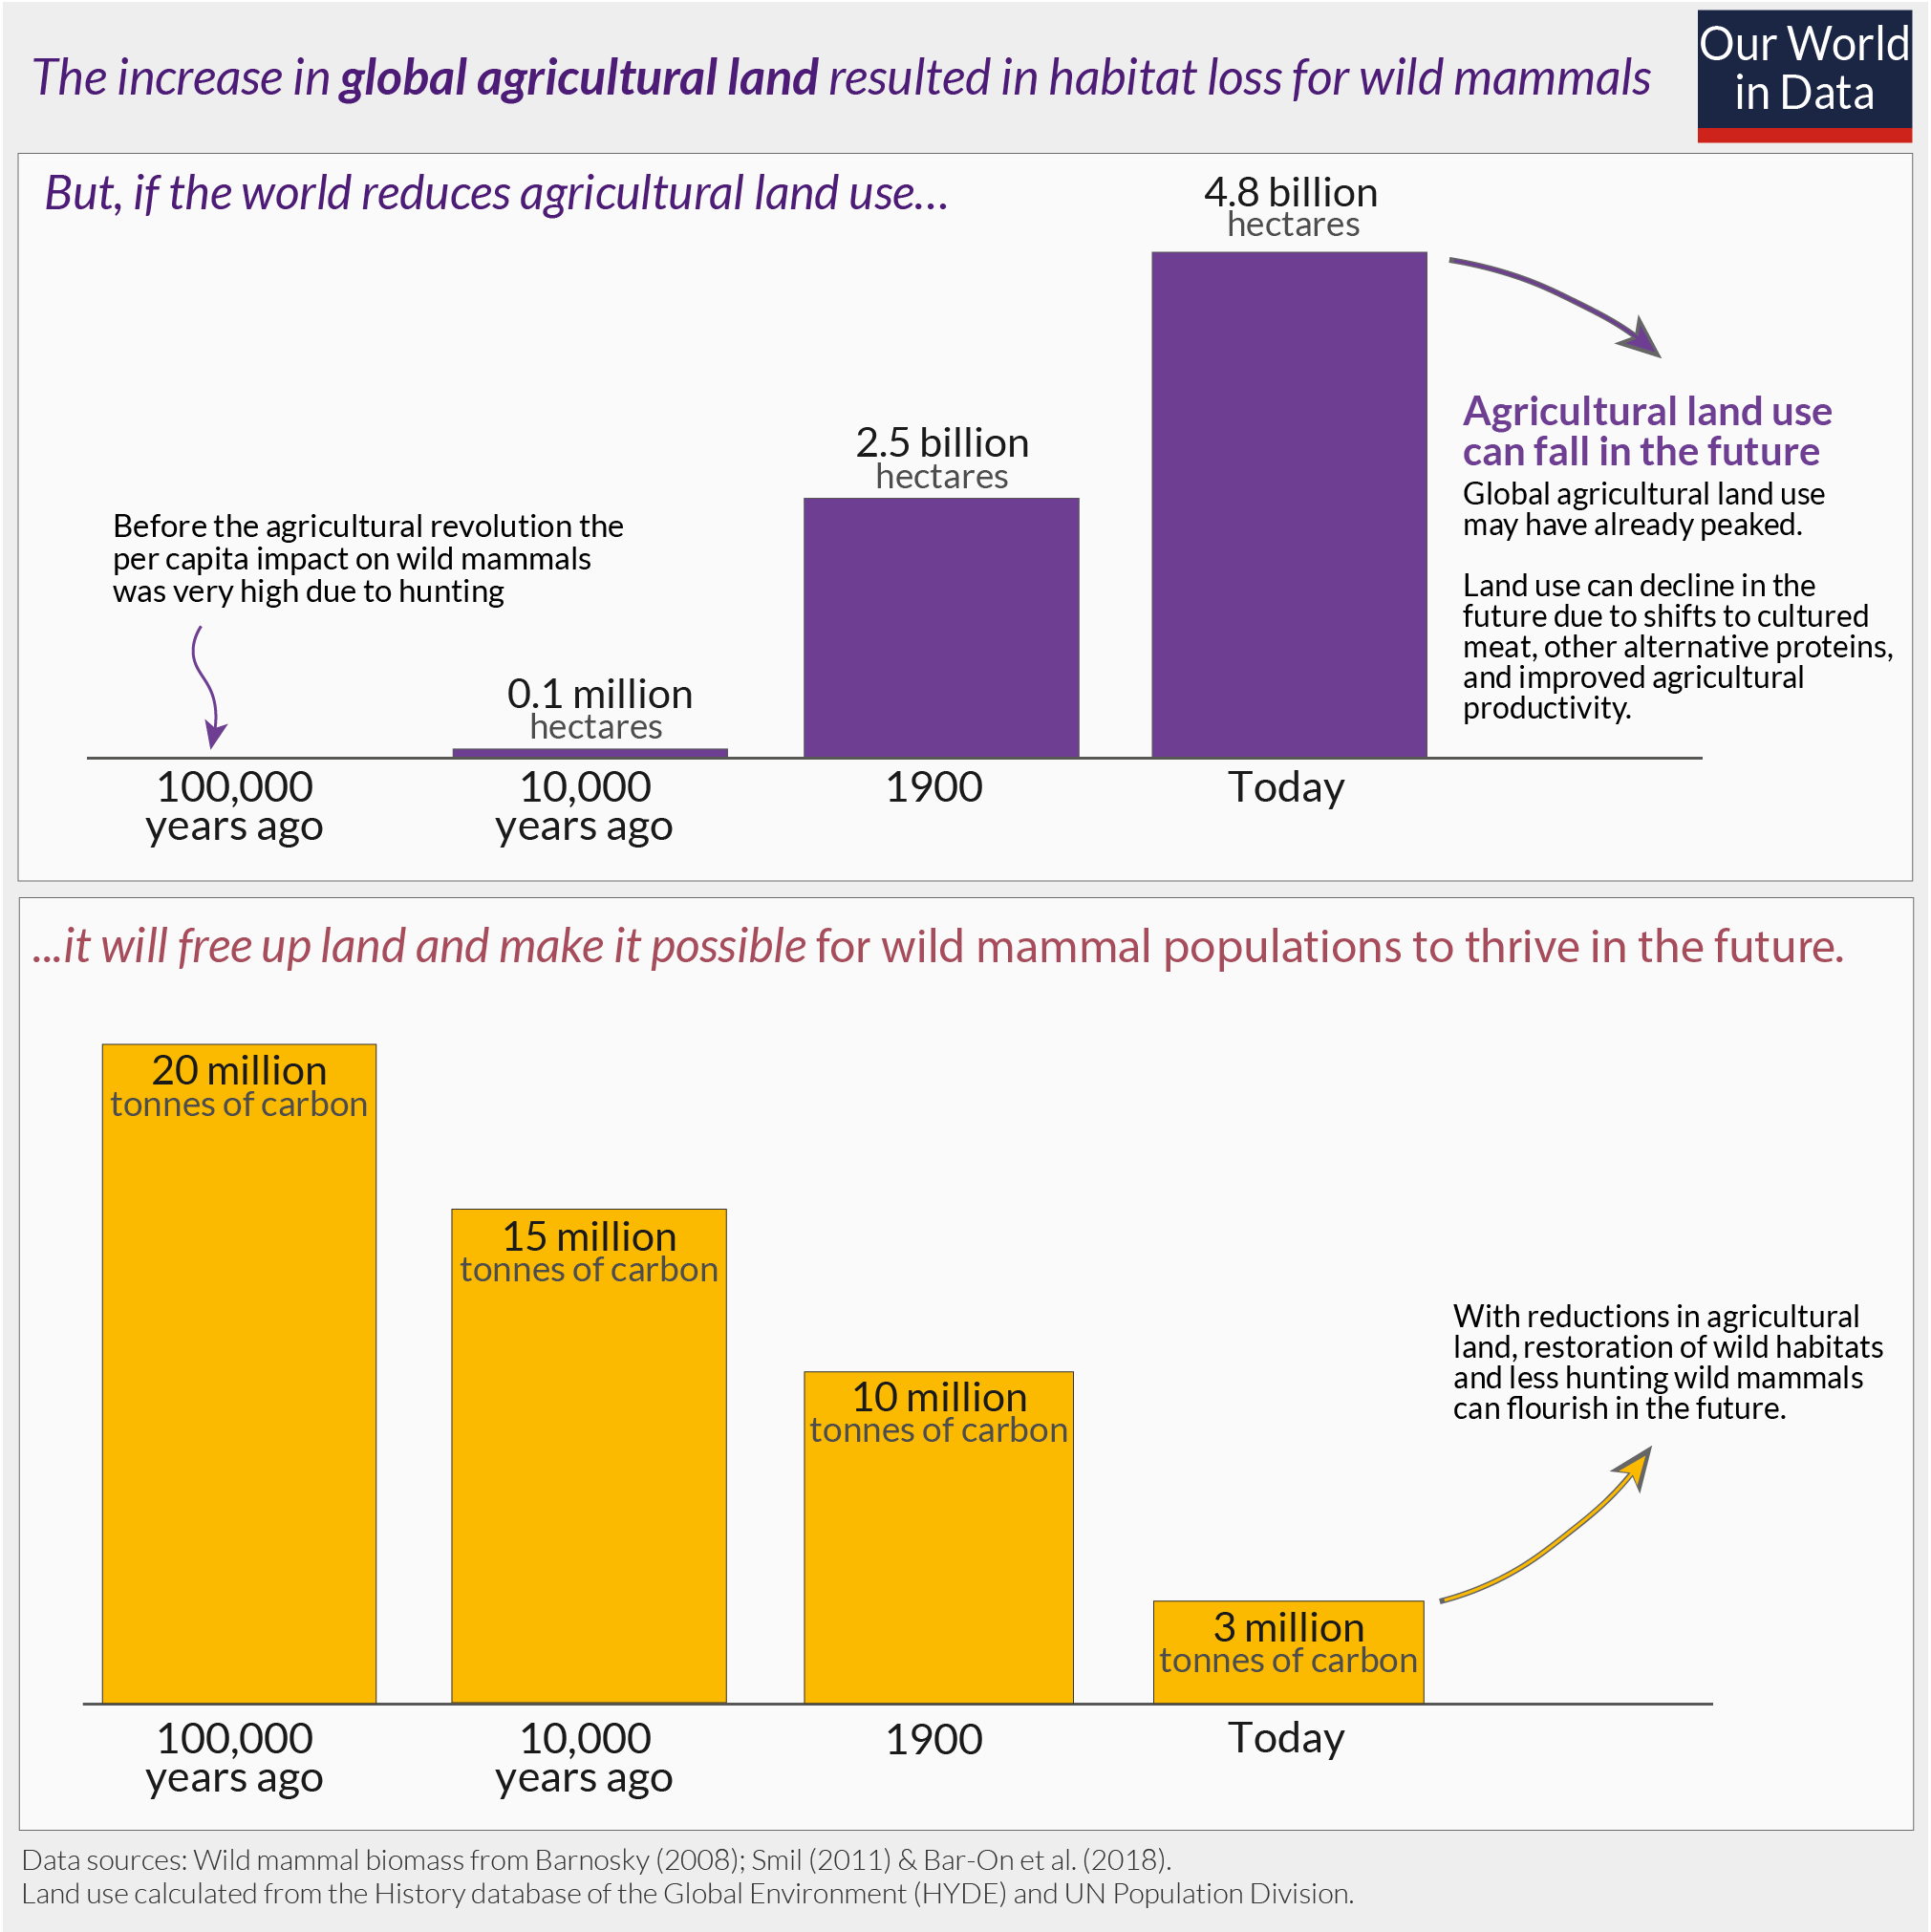
But, there might be positive signs: the world may have already passed ‘peak agricultural land’. The UN Food and Agriculture Organization reports a decline in global agricultural land since 2000: falling from 4.9 to 4.8 billion hectares. A very small decline, but signs that we could be at a turning point.
I’ve tried to capture what the future could look like in this final chart. It shows the rise in global agricultural land use over these millennia and the decline in wild biomass that we’ve already seen. But looking to the future, a decline in agricultural land alongside a rise in wild mammals is possible. How can we achieve this?

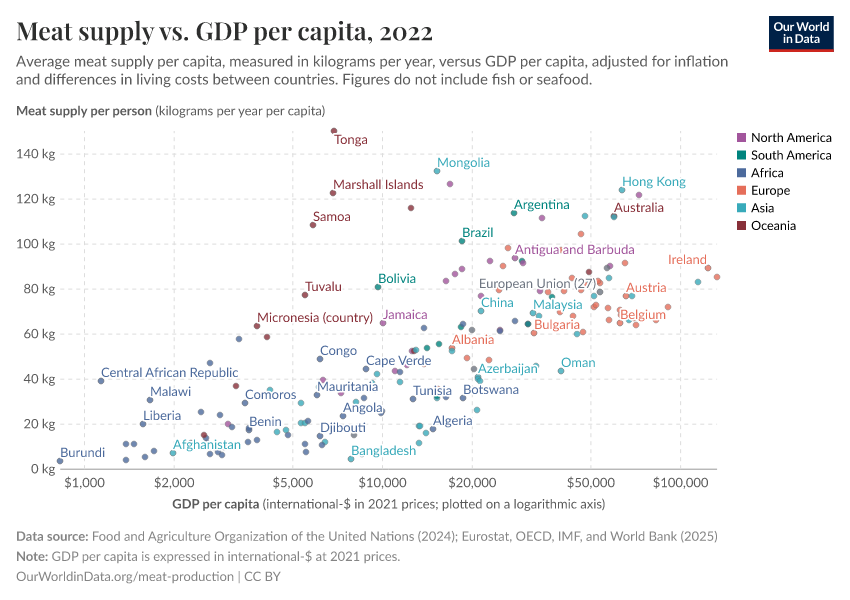
Some people are in favour of a switch to traditional plant-based diets: cereals, legumes, fruits, and vegetables. Because the land use of plant-based diets is smaller than meat-based diets this is definitely a sustainable option; those who adopt such diets have a low environmental footprint. But many people in the world just really like meat and for those that can afford it, it’s a central part of their diet. For many of those who can’t aspire to be able to do so; we see this when we look at how meat consumption rises with income.
With new technologies, it’s possible to enjoy meat or meat-like products without raising or consuming any animals at all. We can have our cake and eat it; or rather, we can have our meat and keep our animals too. Food production is entering a new phase where we can move meat production from the farm to the lab. The prospects for cultured meat are growing.
 Damian Carrington
In 2020, Singapore was the first country to bring lab-grown chicken to the market. And it’s not just lab-grown meat that’s on the rise. A range of alternative products using other technologies such as fermentation or plant-based substitutes are moving forward: Beyond Meat, Quorn and Impossible Foods are a few examples.


The biggest barriers – as with all technologies in their infancy – is going to be scale and affordability. If these products are to make a difference at a global scale we need to be able to produce them in large volumes and at low cost. This is especially true if we want to offer an alternative to the standard ‘wild animal to livestock’ transition for lower-income countries. They have to be cheaper than meat.
It’s going to be a challenge. But it’s an incredibly exciting one. For the first time in human history, we could decouple human progress from ecological degradation. The game between humans and wild animals no longer needs to be zero-sum. We can reduce poaching and restore old habitats to allow wild mammals to flourish. Doing so does not have to come at the cost of human wellbeing. We can thrive alongside, rather than compete with, the other mammals that we share this planet with.
Quaternary Megafauna Extinctions
IN THIS SECTION
- Did humans cause the Quaternary Megafauna Extinction?
Humans have had such a profound impact on the planet’s ecosystems and climate that Earth might be defined by a new geological epoch: the Anthropocene (where “anthro” means “human”). Some think this new epoch should start at the Industrial Revolution, some at the advent of agriculture 10,000 to 15,000 years ago. This feeds into the popular notion that environmental destruction is a recent phenomenon.
The lives of our hunter-gatherer ancestors are instead romanticized. Many think they lived in balance with nature, unlike modern society where we fight against it. But when we look at the evidence of human impacts over millennia, it’s difficult to see how this was true.
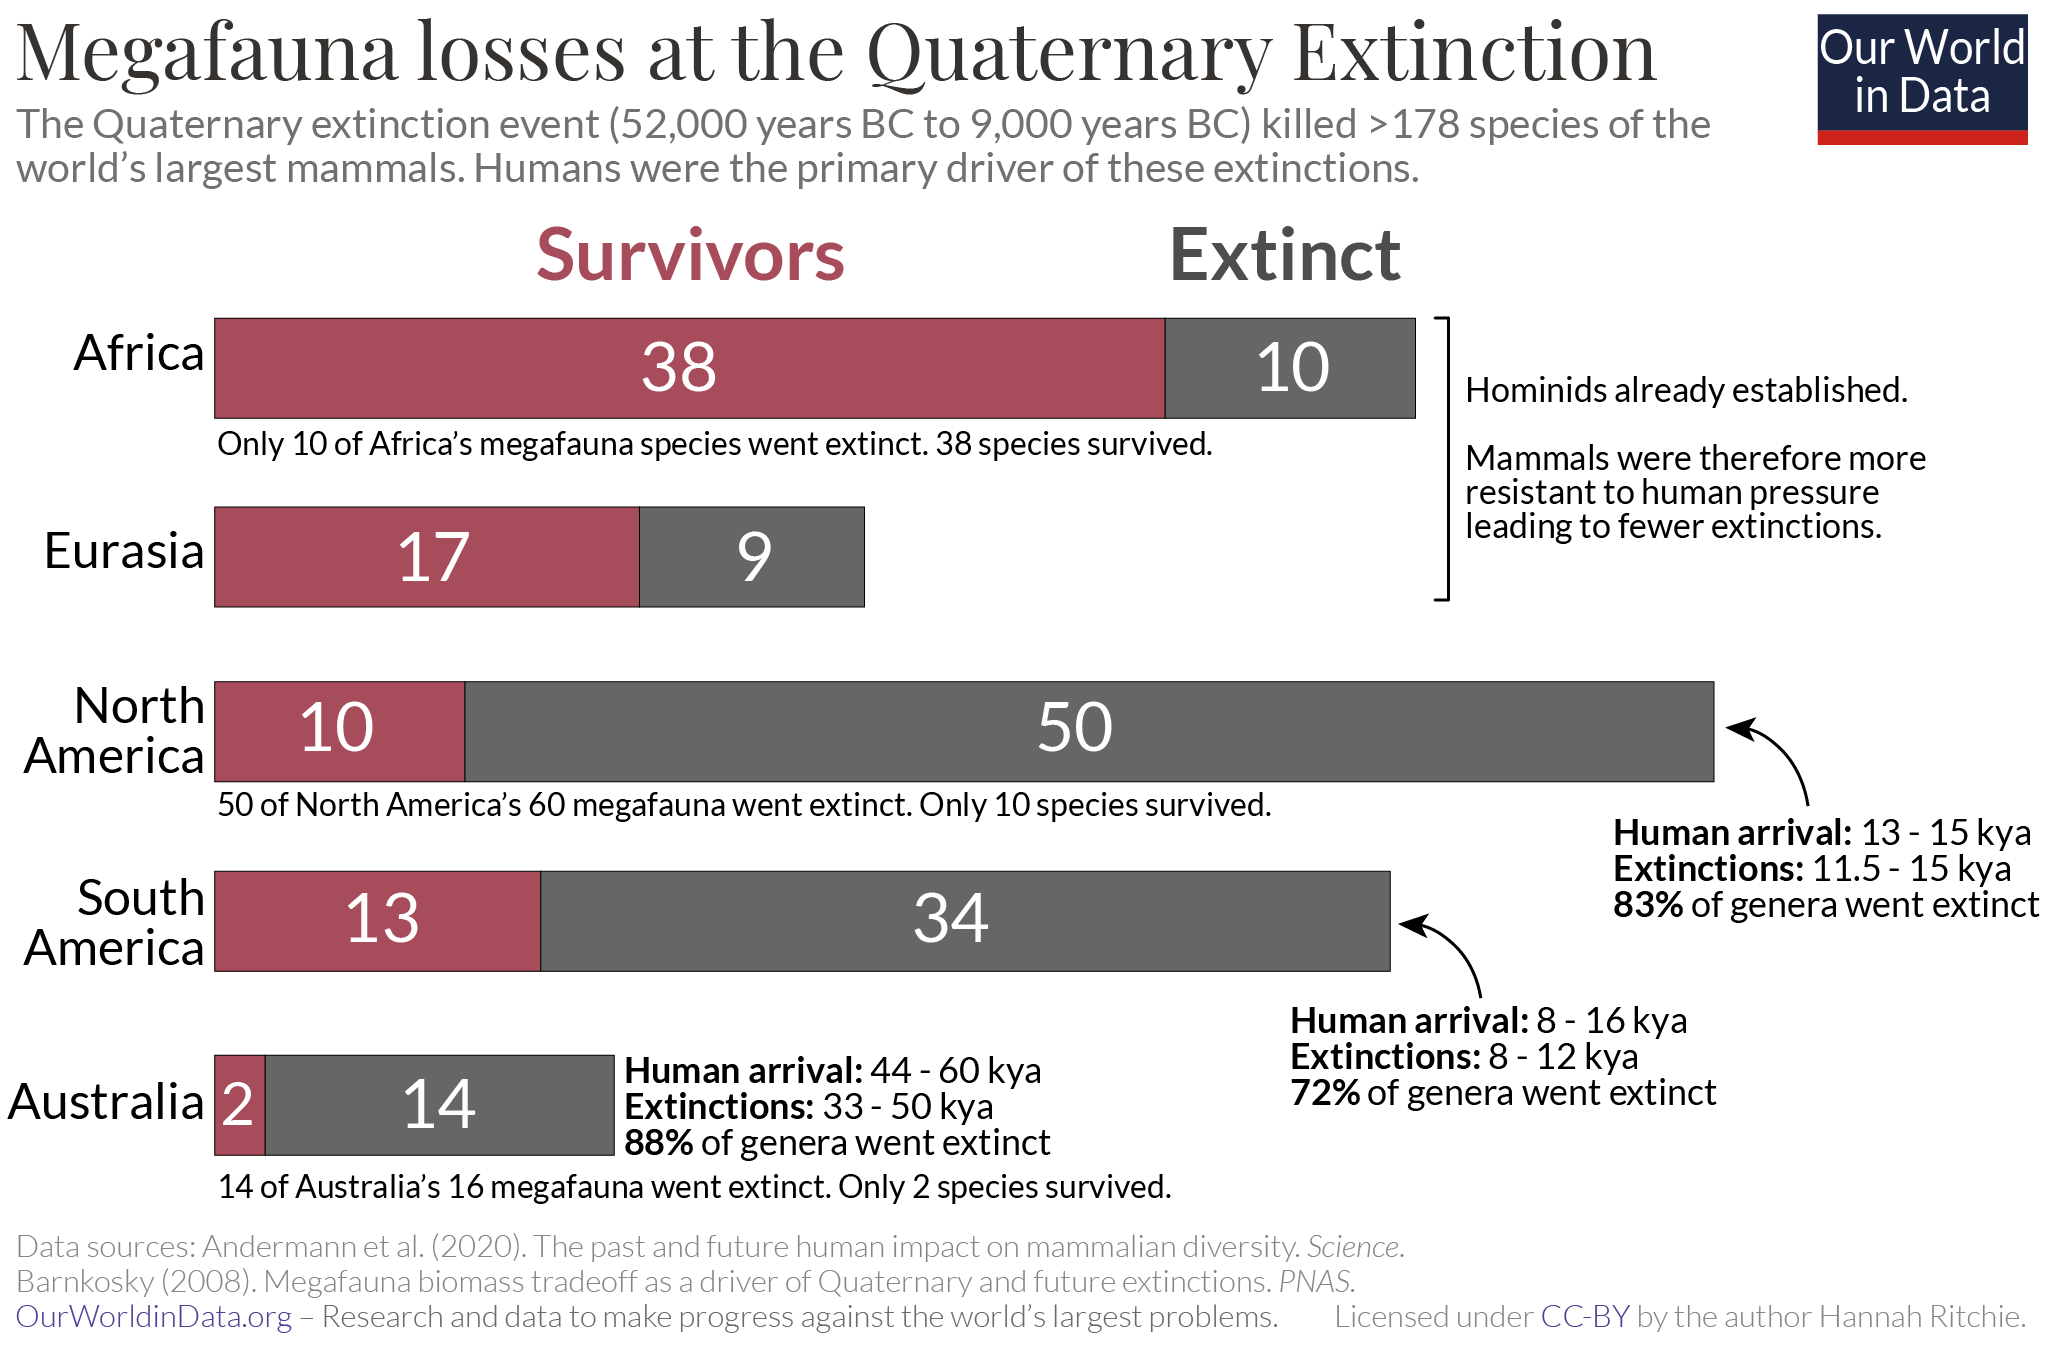
Our ancient ancestors drove more than 178 of the world’s largest mammals (‘megafauna’) to extinction. This is known as the ‘Quaternary Megafauna Extinction’ (QME). The extent of these extinctions across continents is shown in the chart. Between 52,000 and 9,000 BC, more than 178 species of the world’s largest mammals (those heavier than 44 kilograms – ranging from mammals the size of sheep to elephants) were killed off. There is strong evidence to suggest that these were primarily driven by humans – we look at this in more detail later.
Africa was the least hard-hit, losing only 21% of its megafauna. Humans evolved in Africa, and hominins had already been interacting with mammals for a long time. The same is also likely to be true across Eurasia, where 35% of megafauna were lost. But Australia, North America and South America were particularly hard-hit; very soon after humans arrived, most large mammals were gone. Australia lost 88%; North America lost 83%; and South America, 72%.
Far from being in balance with ecosystems, very small populations of hunter-gatherers changed them forever. By 8,000 BC – almost at the end of the QME – there were only around 5 million people in the world. A few million killed off hundreds of species that we will never get back.
Did humans cause the Quaternary Megafauna Extinction?
The driver of the QME has been debated for centuries. Debate has centred around how much was caused by humans and how much by changes in climate. Today the consensus is that most of these extinctions were caused by humans.
There are several reasons why we think our ancestors were responsible.
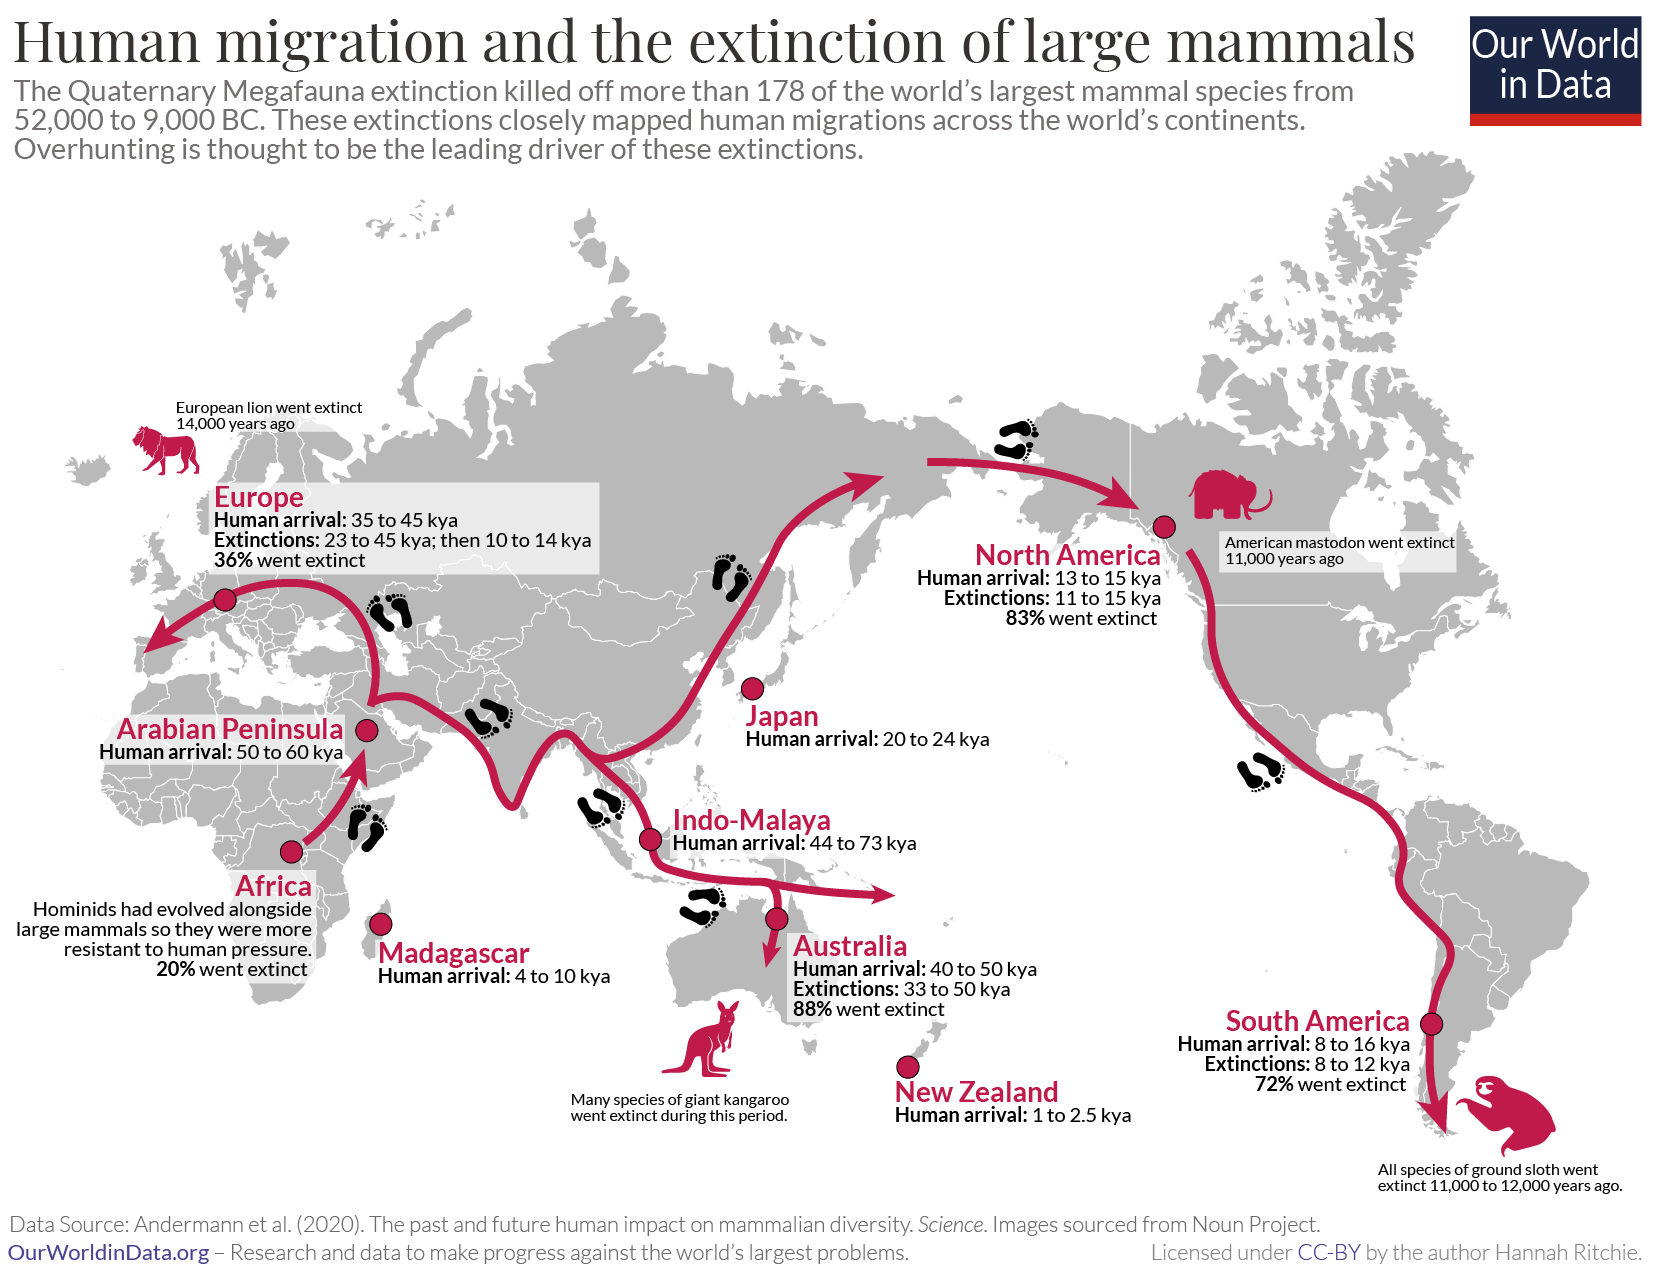
Extinction timings closely match the timing of human arrival. The timing of megafauna extinctions was not consistent across the world; instead, the timing of their demise coincided closely with the arrival of humans on each continent. The timing of human arrivals and extinction events is shown on the map.
Humans reached Australia somewhere between 65 to 44,000 years ago.11 Between 50 and 40,000 years ago, 82% of megafauna had been wiped out. It was tens of thousands of years before the extinction in North and South America occurred. And several more before these occurred in Madagascar and the Caribbean islands. Elephant birds in Madagascar were still present eight millennia after the mammoth and mastodon were killed off in America. Extinction events followed man’s footsteps.
Significant climatic changes tend to be felt globally. If these extinctions were solely due to climate we would expect them to occur at a similar time across the continents.
QME selectively impacted large mammals. There have been many extinction events in Earth’s history. There have been five big mass extinction events and a number of smaller ones. These events don’t usually target specific groups of animals. Large ecological changes tend to impact everything from large to small mammals, reptiles, birds, and fish. During times of high climate variability over the past 66 million years (the ‘Cenozoic period’), neither small nor large mammals were more vulnerable to extinction.12
The QME was different and unique in the fossil record: it selectively killed off large mammals. This suggests a strong influence from humans since we selectively hunt larger ones. There are several reasons why large mammals in particular have been at greater risk since the arrival of humans.
Islands were more heavily impacted than Africa. As we saw previously, Africa was less heavily impacted than other continents during this period. We would expect this since hominids had been interacting with mammals for a long time before this. These interactions between species would have impacted mammal populations more gradually and to a lesser extent. They may have already reached some form of equilibrium. When humans arrived on other continents – such as Australia or the Americas – these interactions were new and represented a step-change in the dynamics of the ecosystem. Humans were an efficient new predators.
There have now been many studies focused on the question of whether humans were the key driver of the QME. The consensus is yes. Climatic changes might have exacerbated the pressures on wildlife, but the QME can’t be explained by climate on its own. Our hunter-gatherer ancestors were key to the demise of these megafaunas.
Human impact on ecosystems, therefore, dates back tens of thousands of years, despite the Anthropocene paradigm that is this a recent phenomenon. We’ve not only been in direct competition with other mammals, but we’ve also reshaped the landscape beyond recognition. Let’s take a look at this transformation.
Mammals across the world today
IN THIS SECTION
- Wild mammals make up only a few percent of the world’s mammals
- Where are mammal hotspots across the world?
Wild mammals make up only a few percent of the world’s mammals
In a related article, we look at the long history of the relationship between human populations and wild mammals. Since the rise of humans, wild terrestrial mammal biomass has declined by 85%. This was first driven by hunting: a global population of less than 5 million early humans hunted more than 100 of largest mammals to extinction. Since the agricultural revolution, the decline in wild mammals has been driven through a mix of hunting but also habitat loss from the expansion of agricultural land.
In the visualization, we see estimates of the composition of the world’s mammals spanning from 100,000 years ago through to today. These estimates come from three key sources: long historical figures come from the work of Anthony Barnosky (2008); figures for the year 1900 figures from Vaclav Smil (2011); and 2015 figures from Yinon Bar-On, Rob Phillips and Ron Milo (2018).13
The dominance of humans today is clear: we and our livestock account for 96% of global mammal biomass. Wildland mammals make up just 2%.
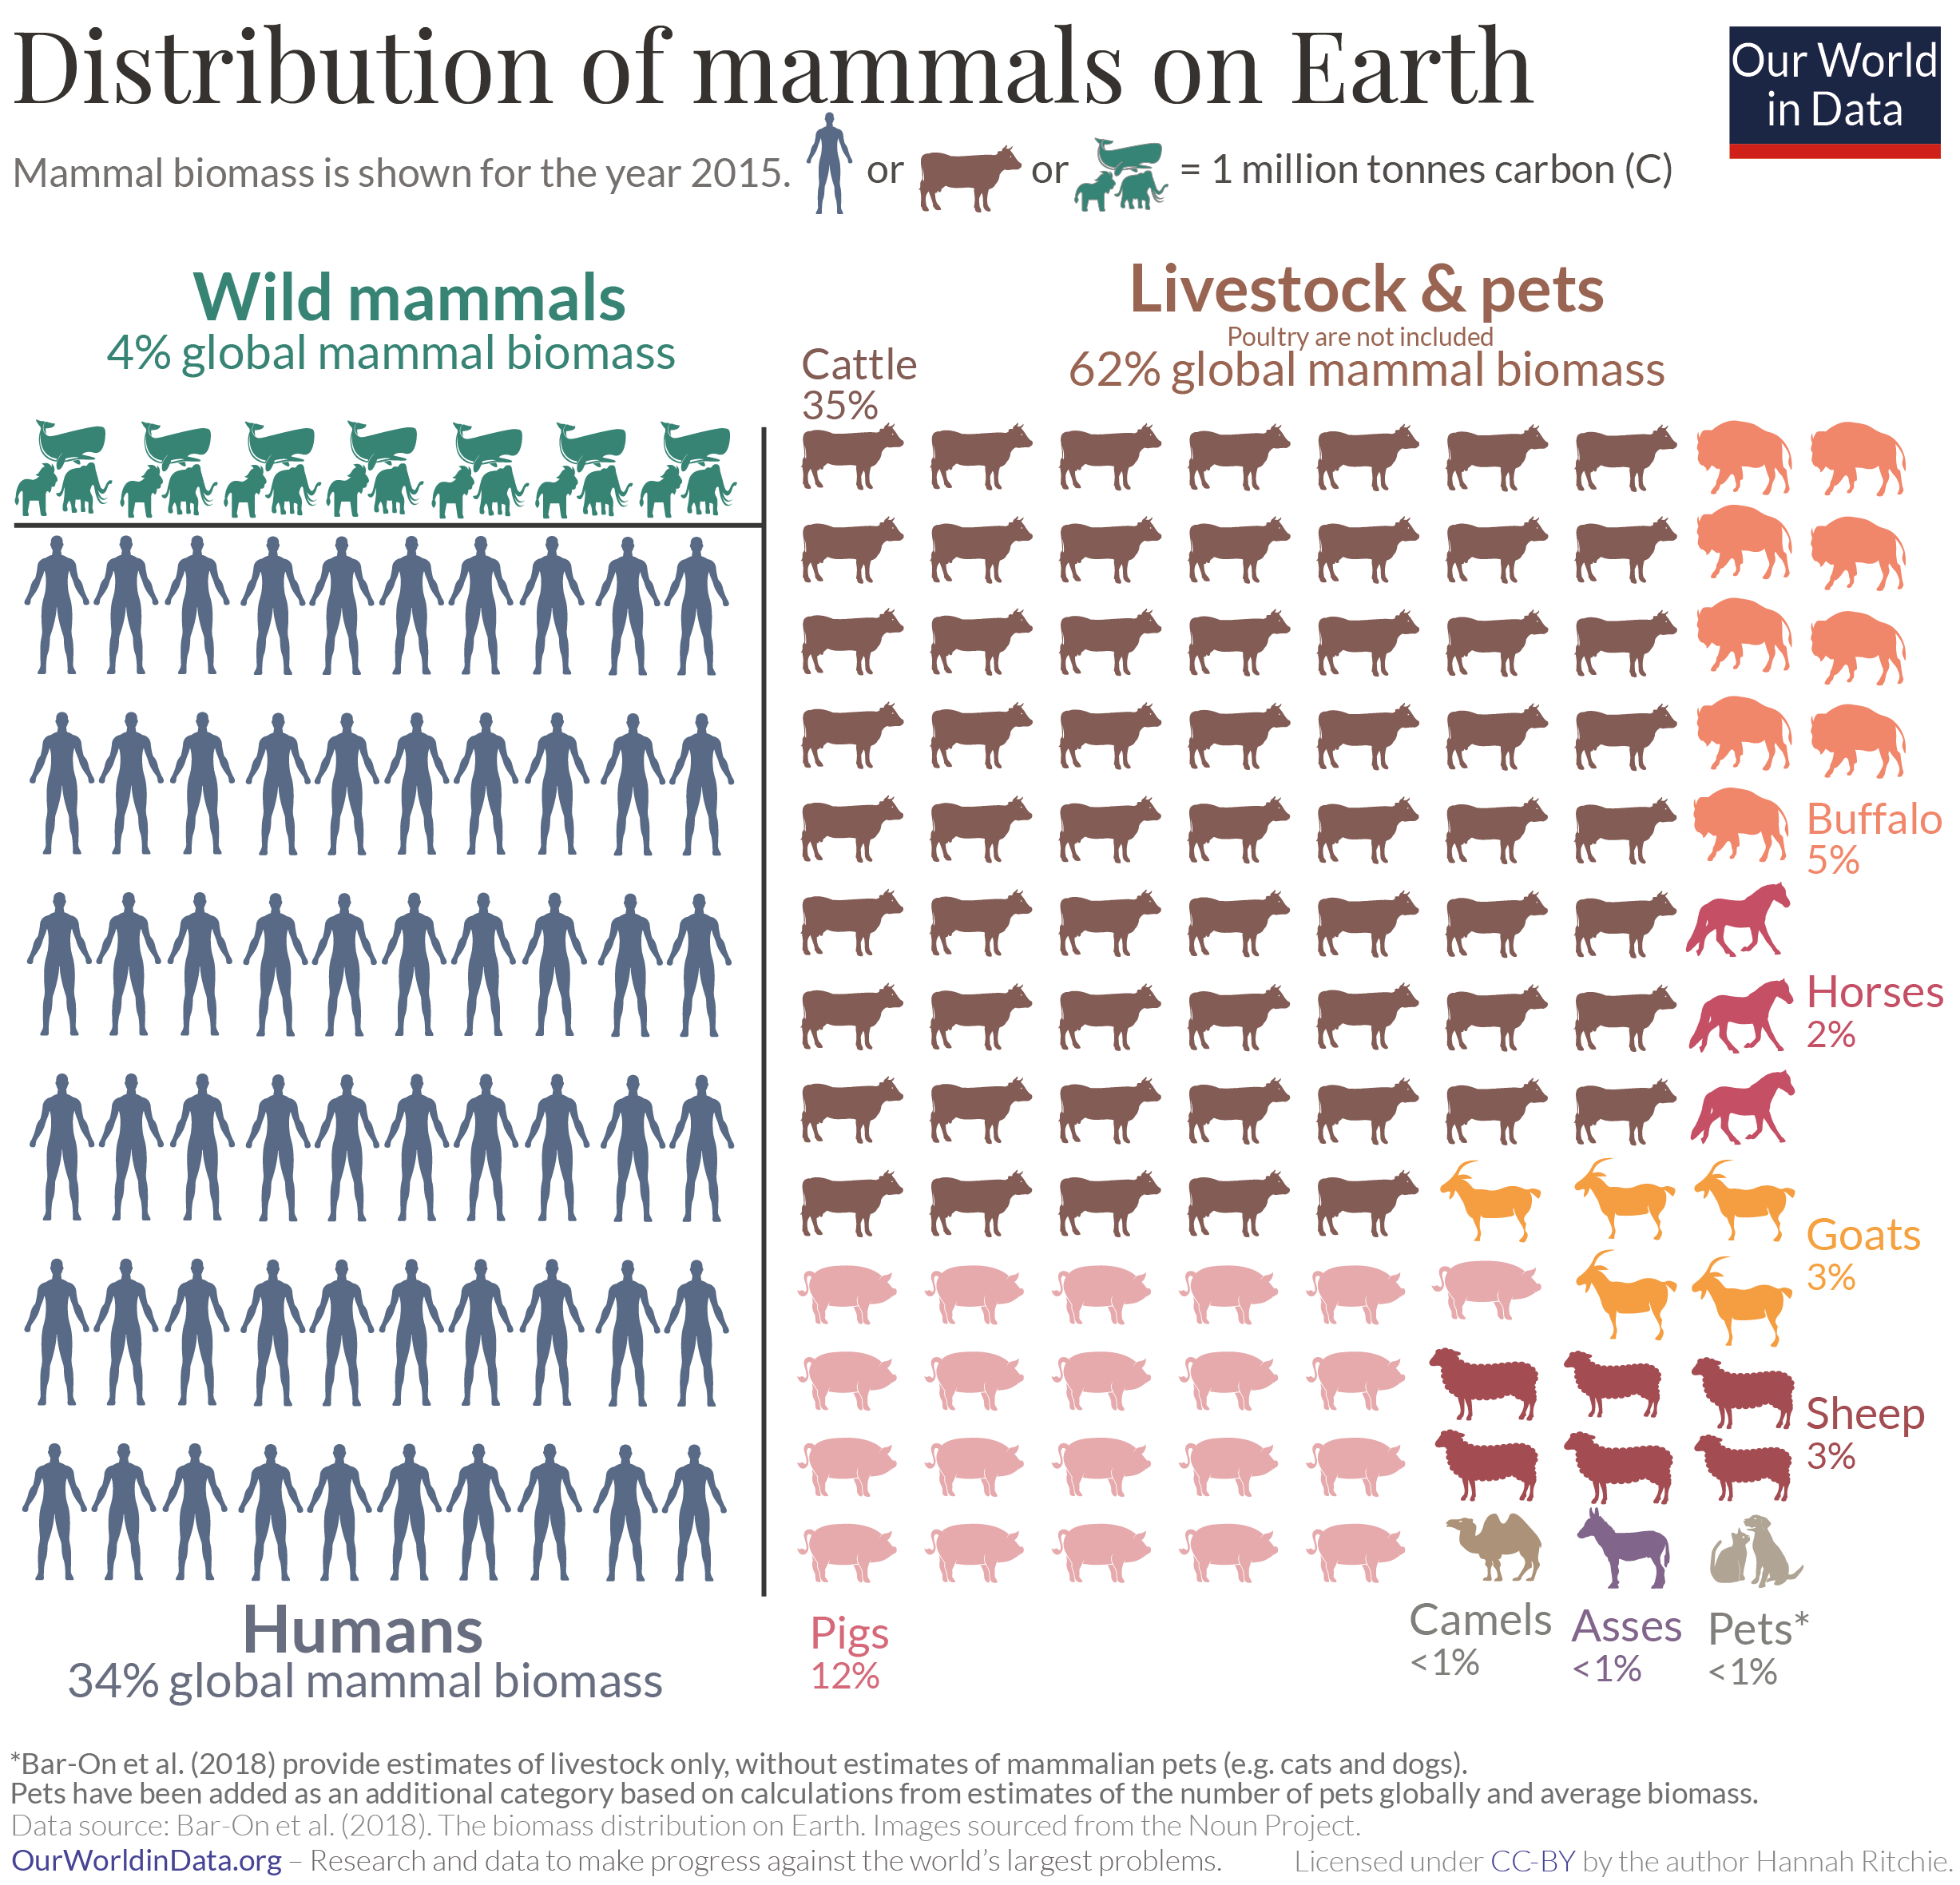
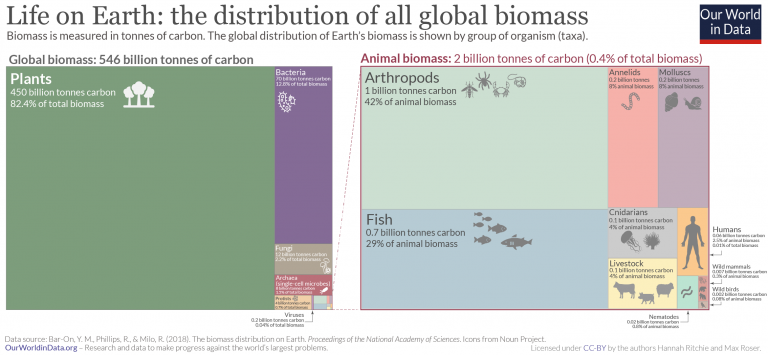
In the chart we see the distribution of global mammal biomass in 2015, split between humans, livestock and wild animals. This data is sourced from the same study by Yinon Bar-On, Rob Phillips and Ron Milo (2018) that we used before.14 Each icon is equivalent to approximately one million tonnes of carbon. This figure includes both terrestrial and marine wild mammals, meaning its share rises from 2% that we saw above (which was limited to land mammals) to 4% of all mammals.
The dominance of humans is clear. Human biomass alone is almost ten times greater than wild mammals. The same applies to the cows we raise: cattle weigh almost ten times as much as all wild mammals combined. The biomass of all of the world’s wild mammals is about the same as our sheep.
Here we focus on mammal populations, so neither wild birds nor poultry are included. But for birds the story is similar: our poultry biomass is more than twice that of wild birds.
Humans make up only 0.01% of life on Earth, but have and continue to have, a disproportionate impact on other aspects of life.
Where are mammal hotspots across the world?
Tigers, elephants, gorillas, and giraffes: many of the world’s most charismatic animals are mammals.15 But the chances of seeing such wildlife vary significantly across the world. Some countries have none or very few unique species, whilst others are well-known as biodiversity hotspots.
An important metric for biodiversity and conservation is not only the number of mammal species a country has but more specifically, how many endemic species it has. Endemic species are those which occur naturally in only one country. In other words, species that are unique to a given location.
Species which exist everywhere are less likely to go extinct; severe threats to that species would have to exist in every country in the world. If a species exists in only one country, it might require only localized threats to kill it off.
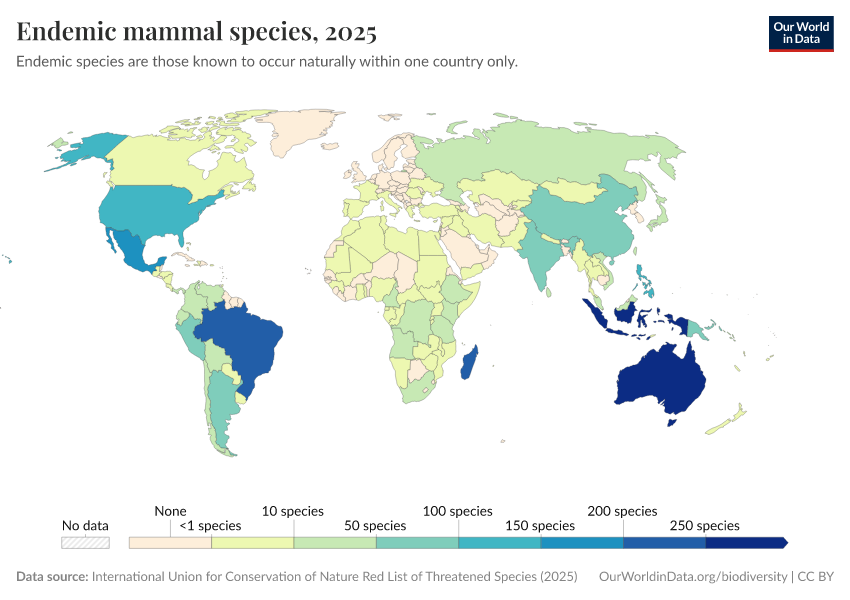
In the map, we see the number of endemic mammal species by country. This helps us to identify which countries have the most unique range of mammals – in a sense, the hotspots for mammal biodiversity.
As we might expect, the three most diverse countries are island states. Indonesia has the largest number of unique mammals, with 281 species. In our related articles exploring some specific mammals, Indonesia stands out: it’s home to the last remaining Sumatran and Javan rhino species.16
Australia and Madagascar – both of which people often associate with high levels of unique biodiversity – also have more than 200 endemic species. Brazil and Mexico complete the top five.
Generally, we see the greatest diversity in mammals across the Americas, Southeast Asia and Pacific. In contrast, there are very few endemic mammal species across Europe: only Spain, Portugal, Italy, Greece, Cyprus, Poland and Ukraine are home to mammal species that don’t occur in any other countries.
Of course, this only tells us half the story. To understand species most at risk of extinction we also need to know where endemic species are most threatened. In a related article, we take a look at the distribution of endemic mammals threatened with extinction across the world.
Mammals at risk of extinction
IN THIS SECTION
- Where in the world are mammals most threatened?
- The largest mammals are at the greatest risk of extinction
- Elephants, rhinos, gorillas: how many of our largest mammals are at risk of extinction?
Where in the world are mammals most threatened?
One-quarter of mammal species are threatened with extinction. Indonesia is home to nearly 200 of these species. In contrast, Sweden has only one, and Finland has only two at risk.
If we’re to protect and conserve the world’s mammals from extinction we first need to know where they’re most threatened.
In our related post, we saw how the diversity of mammal species varies across the world, and where the biodiversity hotspots are. But does this also reflect where mammals are most under threat?
Where are endemic mammal species at risk of extinction?
In the map, we see the number of endemic mammal species which are threatened with extinction in the wild.17 It looks very similar to the map of endemic species.
Indonesia has the most endemic mammals threatened with extinction: 123 species. This means 44% – nearly half – are under threat.18 Madagascar is second on the list, with 115 (56%) species threatened. Australia – despite having the largest number of endemic mammals – has much fewer at risk: with 52 endemics (1-in-5) at risk of extinction.
Mexico, Brazil and India also have more than 25 threatened endemic species.
Where are total mammal species at risk of extinction?
It makes sense to be most concerned about endemic species, or those with a very small geographical range. Once they are lost from these specific areas, they are lost forever. But of course, that doesn’t mean we should ignore non-endemic species.
In this map, you can explore the total number (endemic and non-endemic) of mammal species threatened in each country.
The broad picture is very similar to that of endemic species. The countries with the greatest total number of threatened mammals are (in order): Indonesia, Madagascar, India, Mexico, and Brazil. Again, Europe has relatively low numbers of threatened mammal species; Sweden has only one, and Finland has only two.
Almost all countries have one or more mammal species at risk.19 But, there are large differences in the number and level of threat across the world. If our aim is to protect as many mammals as possible, it’s essential that we know where the largest numbers are threatened.
What’s consistent regardless of whether it’s endemic or non-endemic species, is that the conservation story is very much focused on the tropics. They are the richest in biodiversity, but also where the threats are most severe. As we looked at in a related article, the main pressures on mammals – particularly larger ones – are poaching animals for meat and body parts, and the expansion of agriculture. These environmental pressures are most strongly felt in the tropics: it’s where 95% of deforestation occurs, and is home to the most lucrative animals for illegal wildlife trade.
Understanding where and why this is happening is crucial to saving these species before it’s too late.
The largest mammals are at the greatest risk of extinction
When it comes to wildlife conservation, it’s usually the large charismatic mammals that keep our attention and make us reach into our pockets.20 People love pandas, tigers, polar bears and elephants and want to protect them. We see them through the lens of human interactions: we see them communicate; play; and bond with other animals in the group. It has been shown that we feel a closer emotional response to animals if we see humanistic behaviours in them.21
Favouritism towards these large mammal species might be seen as leading with the heart. If we were to take a rational approach to conservation, would we prioritize differently?
The head and the heart might not be as conflicted as we think. This is because large mammals are the ones that are at the greatest risk of extinction. For millennia, large mammals have been the first to go. This is still the case today.
Large mammals have been at risk since the arrival of humans
Earth has been through five major extinctions. None of these events were selective towards a specific size of the animal; over the past, 66 million years (the ‘Cenozoic period’), neither small nor large mammals were more vulnerable.22
This all changed with the arrival of humans. Until then, there had been an abundance of large mammals. Mammoths; giant ground sloths; woolly rhinoceros and sabertooth tigers were found across all habitable continents.23 Now, most of the world’s large mammals can only be found in Africa.
Most – more than 178 species – of the world’s largest mammals went extinct at the Quaternary Megafauna Extinction (QME); during the Pleistocene period which occurred between 52,000 and 7,000 BC.24 There is growing evidence that this megafauna extinction event was primarily driven by human hunting [we look at this in detail in a related article]. When we track man’s footsteps across the continents we find a wave of extinctions in its shadow. Humans arrived, and soon after the mammals were gone.
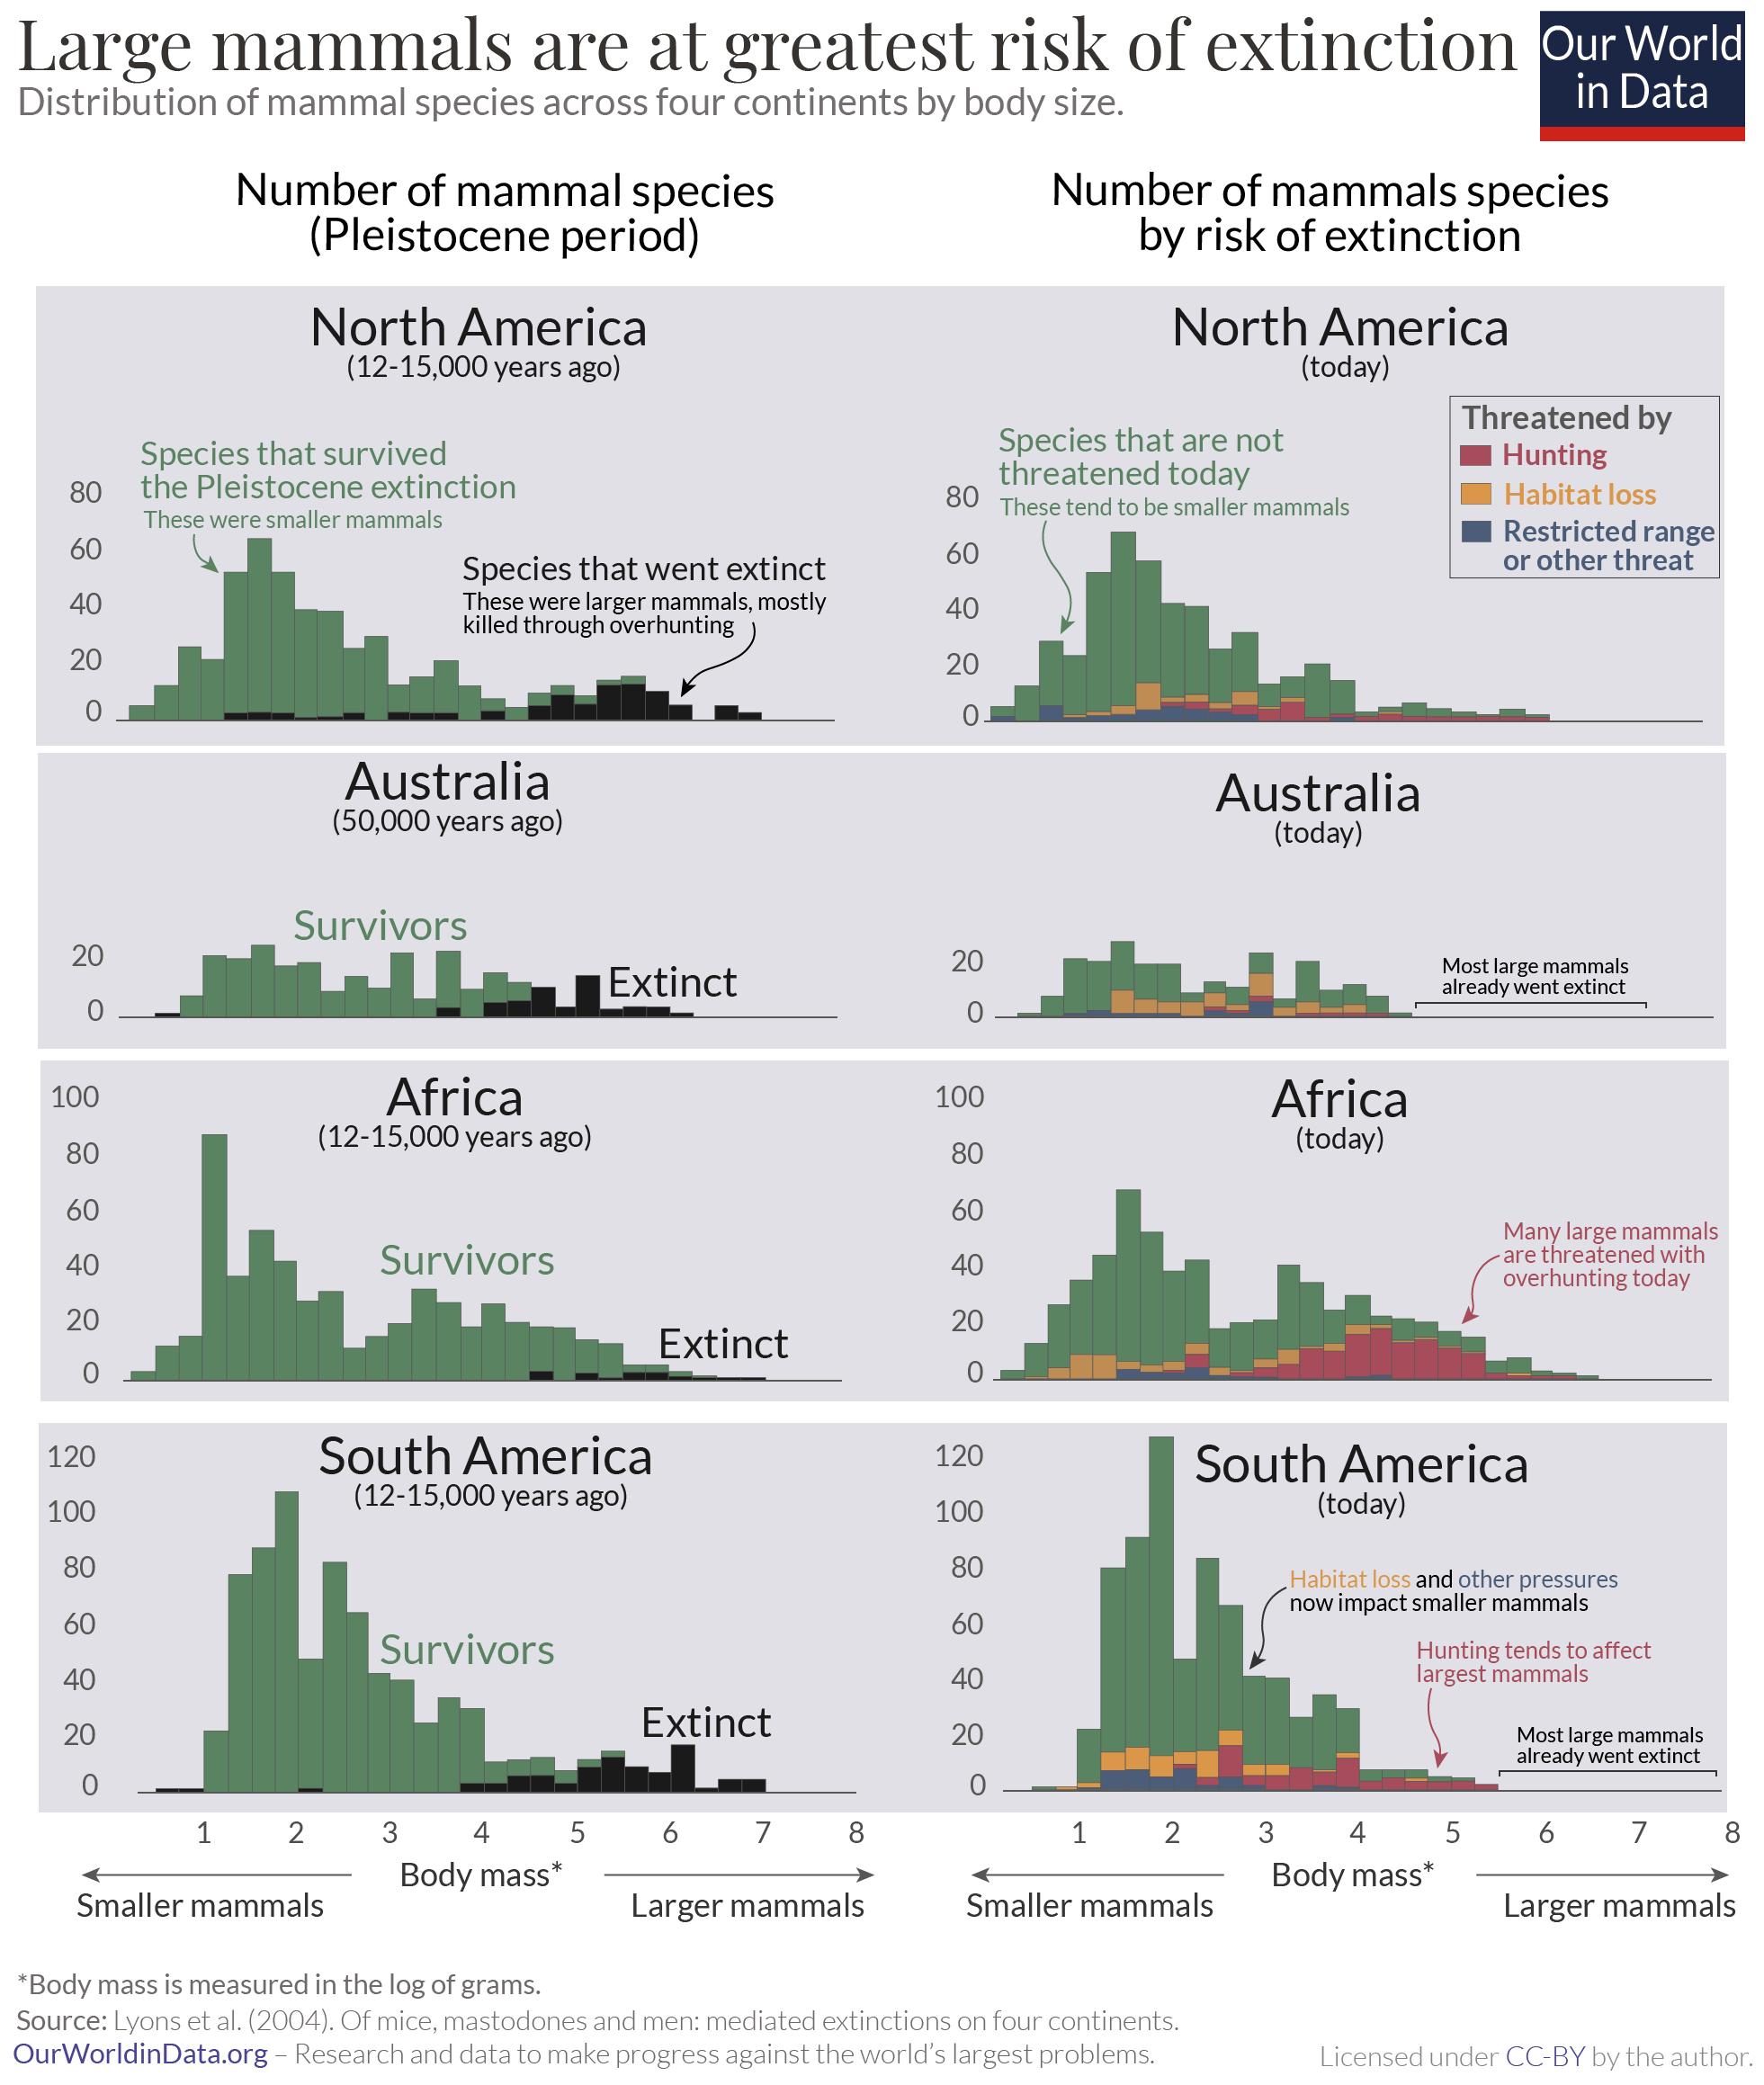
Another key piece of evidence that humans were the driving force is the fact that it was large, not small animals that were killed off. In the chart, we see the size distribution of mammals at this extinction event.25 This shows the number of mammal species that fall into each size category (with the largest on the right, and smallest on the left). The mammals that went extinct on each continent are coloured black.
We see very clearly that there is a strong bias towards the largest mammals. In Australia, 88% of all megafauna (animals weighing more than 40 kilograms) went extinct; in North America, this was 83%; and 72% in South America. Africa was less hard-hit at the QEM because hominids had evolved there over millennia before and so mammals had become more adapted to human pressures.
A size bias of this magnitude was completely unique to the fossil record. Previous extinction events did not discriminate between small or large animals – it wiped them all out. This event marked something new: the arrival of humans.
Why are larger mammals at greater risk of extinction?
Humans are megafauna species ourselves (the average adult weighs more than 40 kilograms). Our arrival, therefore, marked the entrance of a new megafauna predator to compete with. An effective one, as it turns out.
We preferentially hunt larger animals rather than smaller ones. They are easier to spot and track; we get much more meat from them; we could hunt them at a distance once we developed long-range weapons; and some harvest body parts for other uses such as their tusks, bones, for medicine, or for trophy-hunting.
But large mammals are not just at higher risk because we’re more likely to hunt them. They have slower reproduction cycles – they live longer lives, and reproduce less frequently. This means they are slow to restore their populations once they become depleted. Combined, these make a perfect recipe for overhunting.
A new predator on the scene also creates more competition for resources. Megafauna has high energy demands, meaning they need a lot of food to survive. It’s estimated that 10,000 kilograms of prey are needed to support a 90-kilogram carnivore over its lifetime; this means the depletion of food resources has impacted populations of large carnivores such as tigers and leopards.26
Large mammals are still at the highest risk today, but pressure on smaller mammals is also rising
Livestock has spared many wild animals from human hunting. But the poaching of elephants, rhinos, hippos and the rest of the world’s largest mammals still goes on today. Humans hunt them for wild meat, or for their body parts.
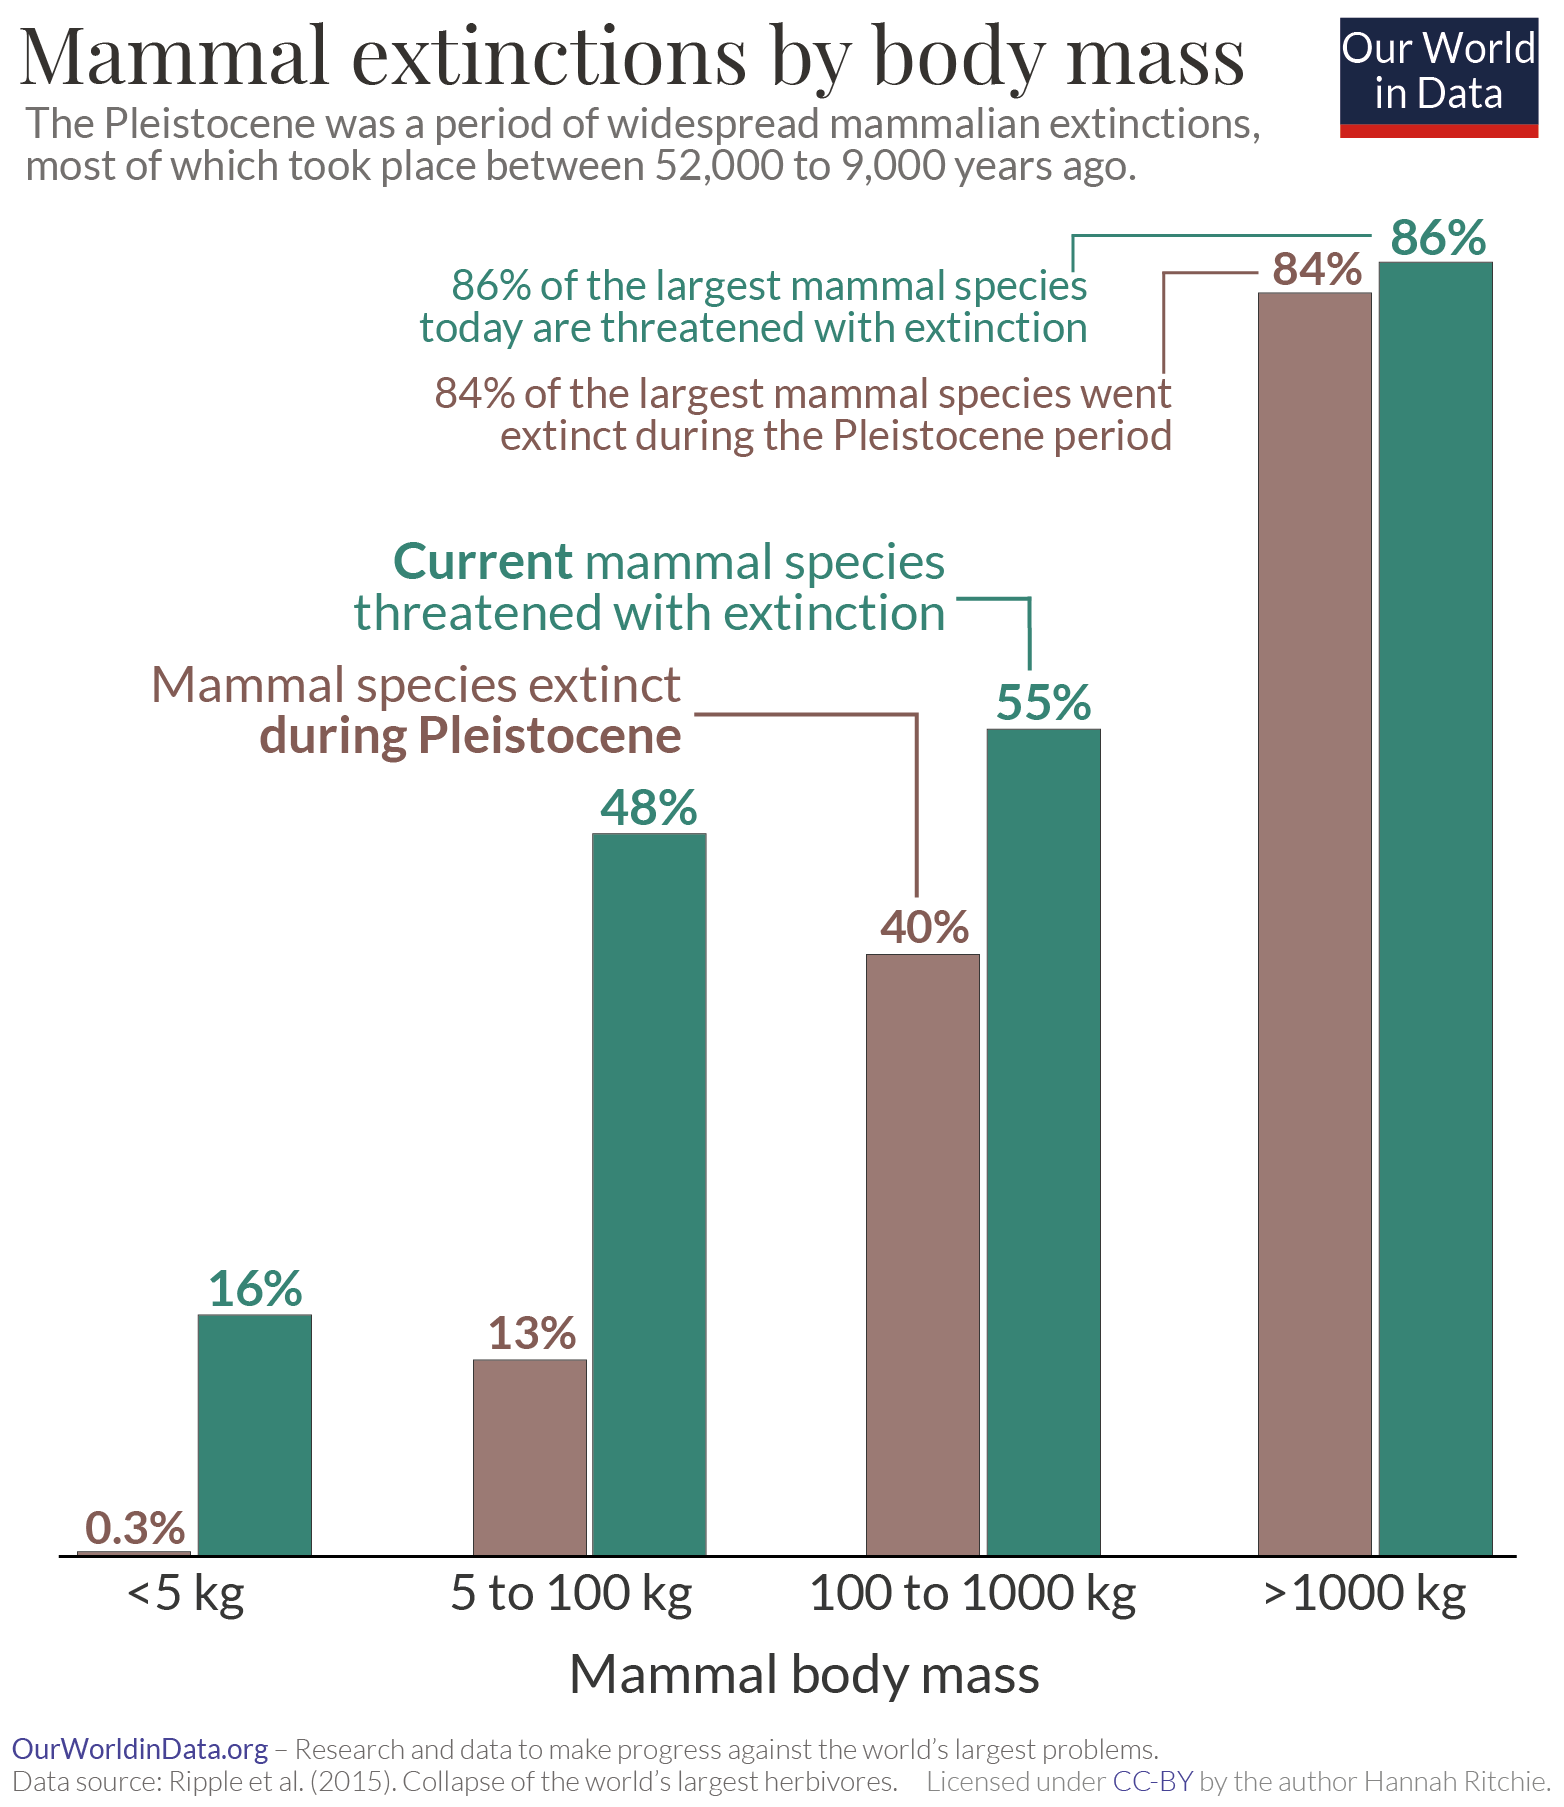
Large mammals are still at the highest risk of extinction. In the chart, we see the share of mammals that went extinct during the Pleistocene period (in brown), and the share that is at risk of extinction today (in green).27 These are categorized by body mass, with the smallest mammals on the left, and largest on the right.
The distribution today is a close mirror of the past. 86% of mammals weighing over one tonne today are threatened with extinction; 84% of species in this category went extinct in the past. As we move to smaller and smaller mammals, the percentage at risk of extinction drops off.
This ‘body size downgrading’ is therefore likely to continue. Researchers estimate that based on current trajectories, within the next few centuries median global body mass could fall from 17 kilograms down to 7 kg. In Africa, from 27 kg to 11 kg; and from 4.4 kg to 1.7 kg in South America.28
But, there’s one important difference today: humans are also now putting increasing pressure on smaller mammals. Millennia ago our impact was direct in the form of hunting. Human populations were small (less than 5 million) and we used very little land for farming. But since then we have used more and more land for agriculture. We cut down one-third of the world’s forests, took over wild grasslands, and fragmented the habitats of many species. This impact has affected both large and very small mammals.
To protect our largest mammals we need to stop poaching. This is the biggest threat to these animals. To protect smaller ones we need to stop encroaching on their habitats. This means bringing deforestation to an end and limiting the expansion of agriculture. Better yet, we could give wildlife some of this land back by rewilding and replanting on land we no longer need.
It is often the biggest, most charismatic animals that steal our hearts. But they’re actually the ones that are most under threat. If we don’t want to lose them, we need to take action. This is at least one area where it makes sense to follow our hearts.
Elephants, rhinos, gorillas: how many of our largest mammals are at risk of extinction?
Since humans arrived, it has been the largest mammals that have been most threatened with extinction. In fact, our hunter-gatherer ancestors drove more than 178 megafauna species to extinction millennia ago. As we discuss in detail in our related article, not only do we have a bias towards large mammals when hunting, these large animals are also much slower to reproduce. This means their populations can decline very quickly.
Let’s then focus on the largest mammals we have today. If we can identify which ones are at-risk; what the pressures are; and where this is happening we can take action to protect them.
In a paper published in Science, a team of researchers looked at the threats to 74 of the world’s largest mammalian herbivore species – animals that typically eat only plants.29 They all weighed more than 100 kilograms. This included families such as elephants, rhinos, hippos, deer, gorillas and bison.
William Ripple and colleagues (2015) found that 60% of the largest herbivores are threatened with extinction; most of them from poaching for meat, medicines or body parts, or from habitat loss; and the majority are in Africa or Asia.
60% of the world’s largest herbivores are threatened with extinction
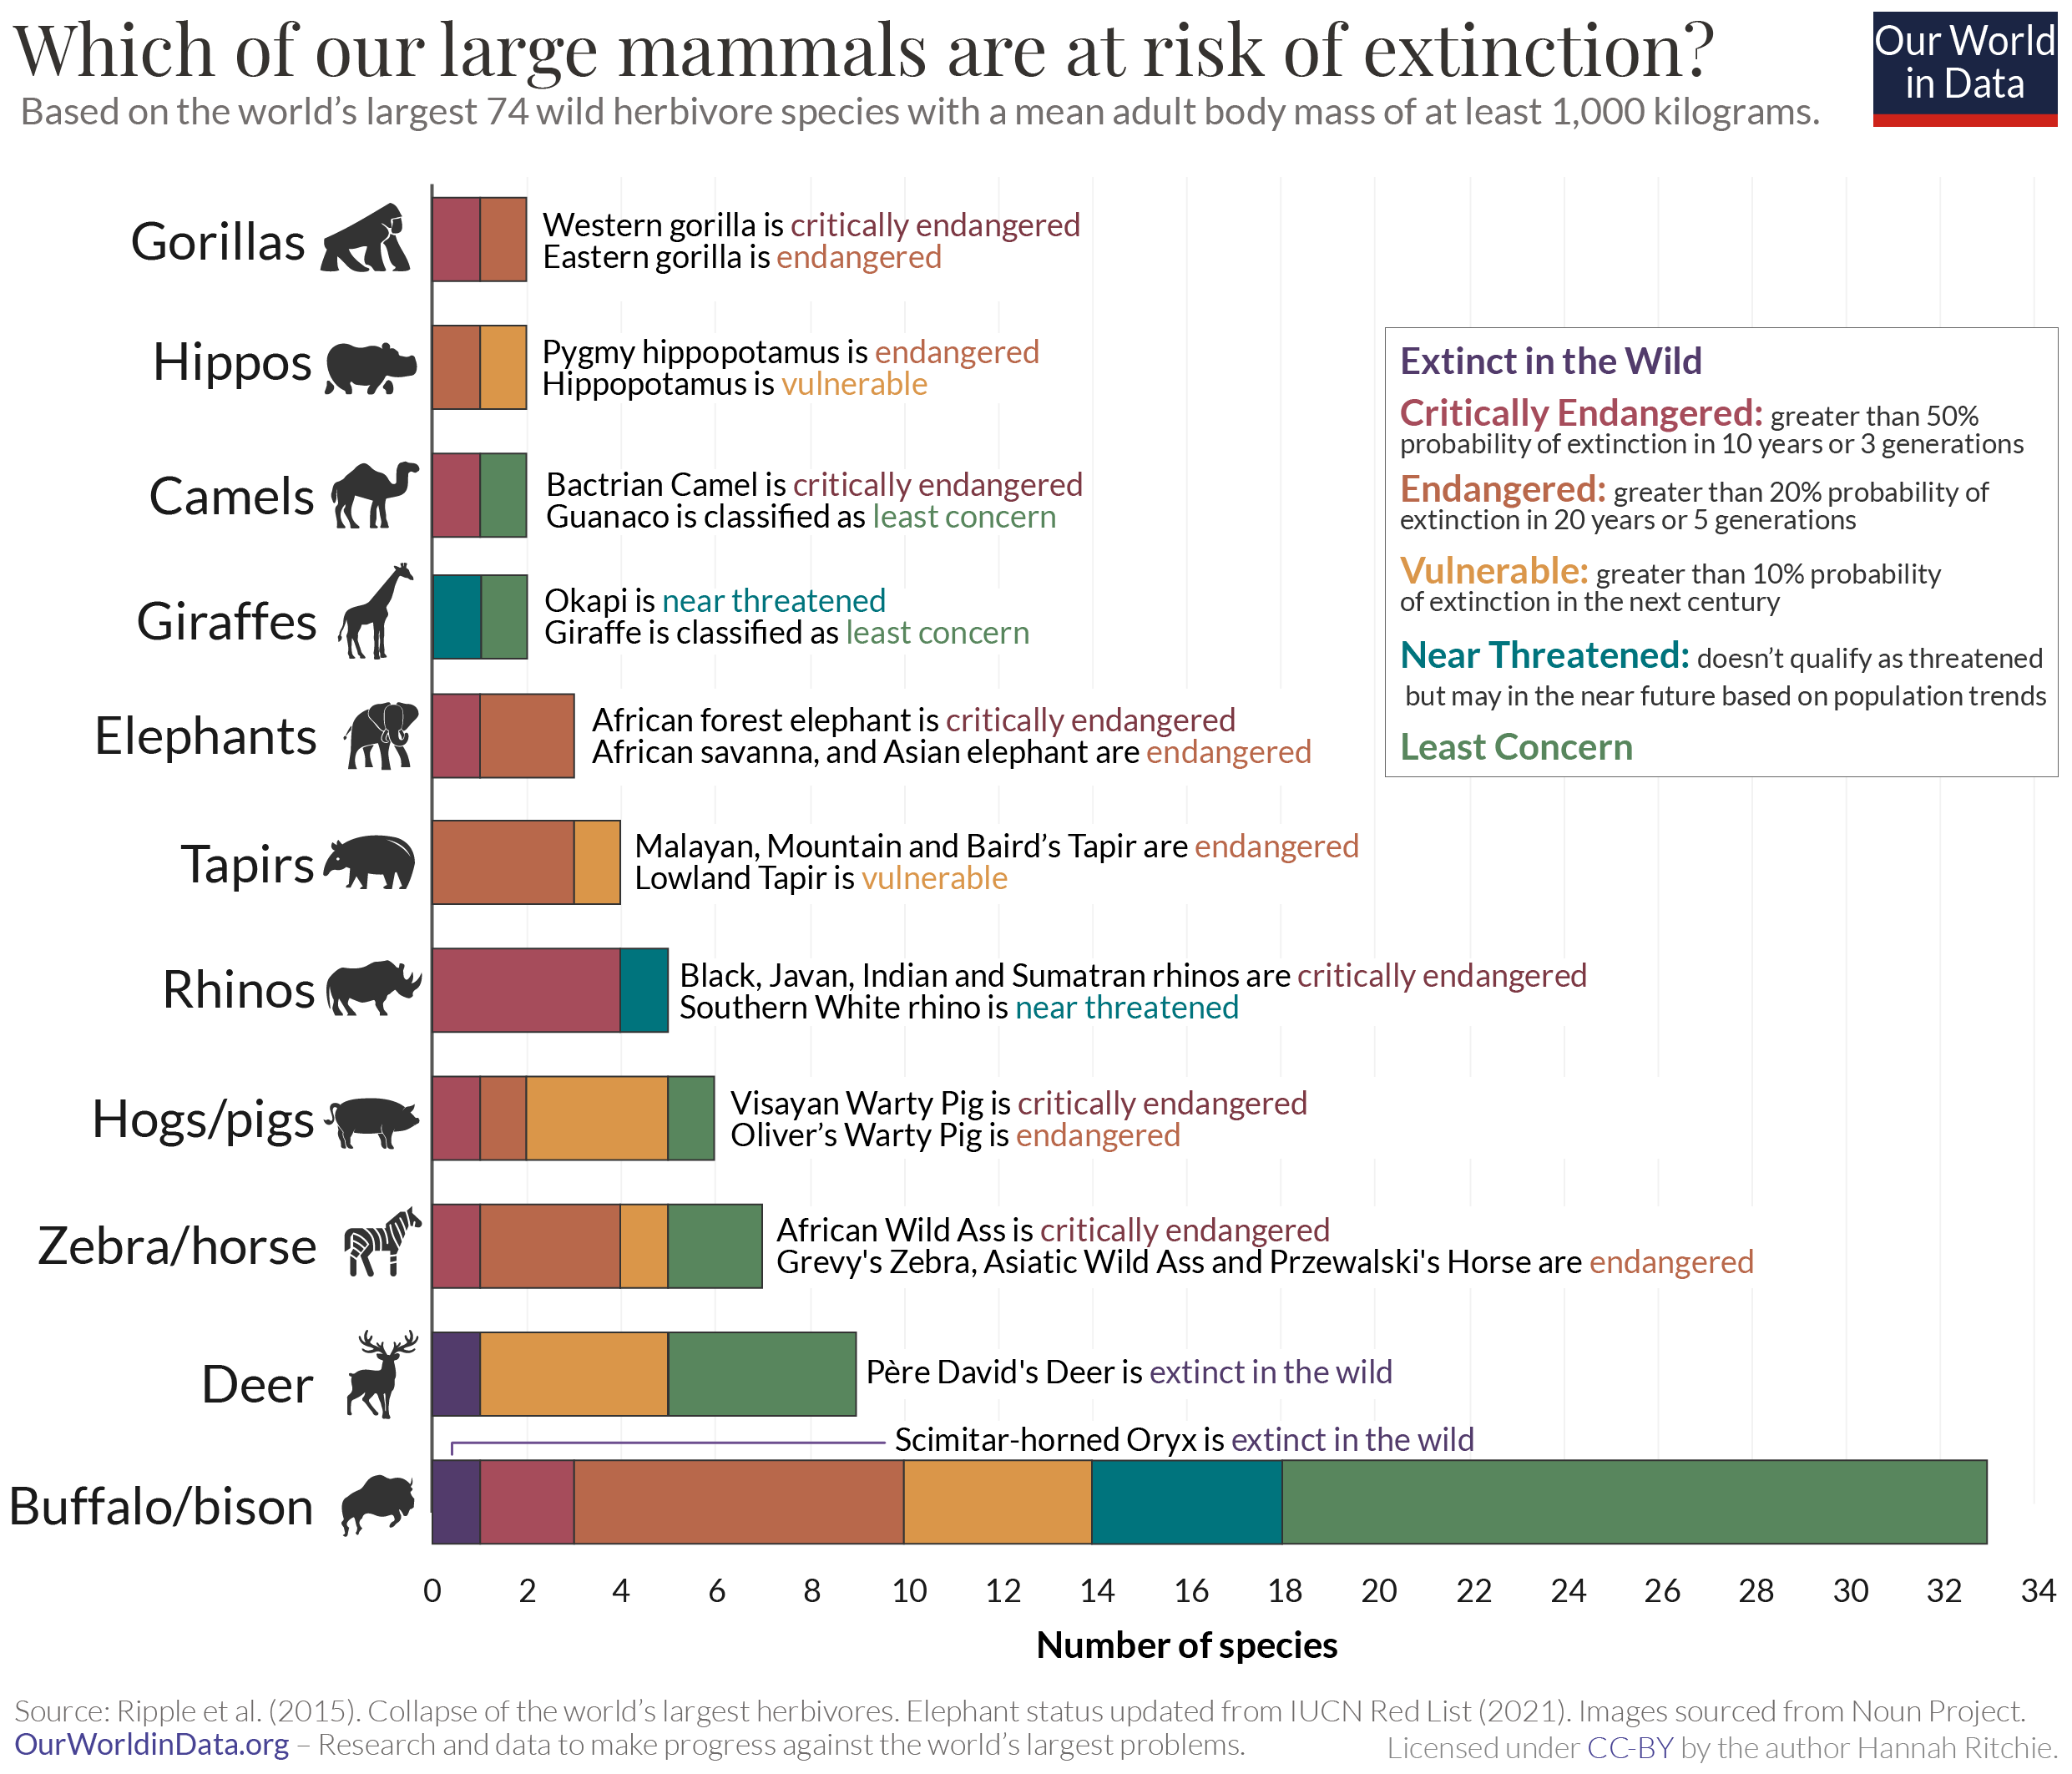
In the chart, we see each family of species categorized by their extinction risk. The IUCN Red List quantifies the extinction risk of these categories in the following way:
- Critically endangered species have a probability of extinction higher than 50% in ten years or three generations;
- Endangered species have a greater than 20% probability in 20 years or five generations;
- Vulnerable has a probability greater than 10% over a century.
Let’s take gorillas as an example. There are two gorilla species – the Western and Eastern gorilla. The Western gorilla is classified as ‘critically endangered; the Eastern gorilla is under slightly less pressure but is still worryingly classified as ‘endangered.

Or rhinos, where the glamorization of their horns has put them under intense pressure. There are five species of rhino: White; Black; Javan; Indian and Sumatran Rhinoceros. All species, except the White Rhino, are critically endangered with very small populations. Even then, it is only one subset of species – the Southern White Rhino – which is doing well. Northern White Rhinos are on the brink of extinction. There are only two left, and both of them are female. Our only hope of saving them is to implant them with an embryo and hope that they reproduce [scientists are planning to do this before 2022]. We take a closer look at rhino populations here.
What’s striking is that most large mammals are threatened to some extent.
Hunting, livestock and habitat loss are the biggest threats to mammals
What is driving some of our favourite animals towards extinction?
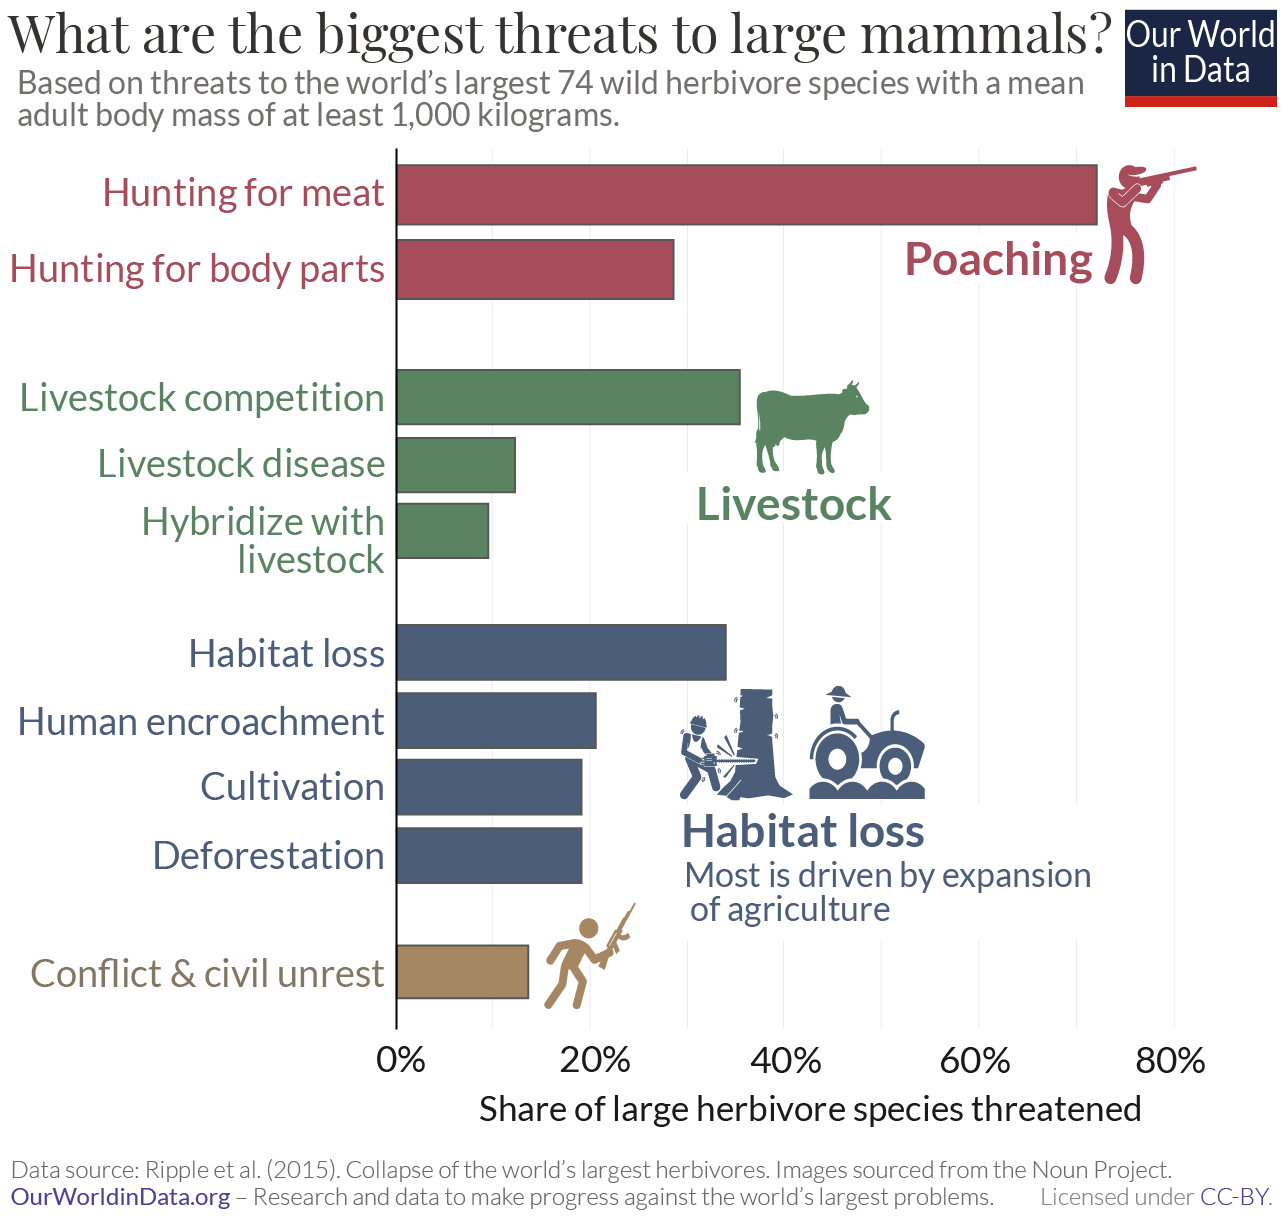
The largest threats are shown in the chart. Poaching is the biggest by far. More than 70% of large herbivores are exploited for their meat and almost 30% for body parts. Many are hunted for both. Elephants are hunted for their skin, trunks and ivory; rhinos for their horns; pigs, zebra, and buffalo for their meat; and gorillas for their feet and hands as trophies.30
Hunting is obviously not a new threat to large mammals: humans have a long history of driving species to extinction through exploitation. But, today we have the means to stop it.
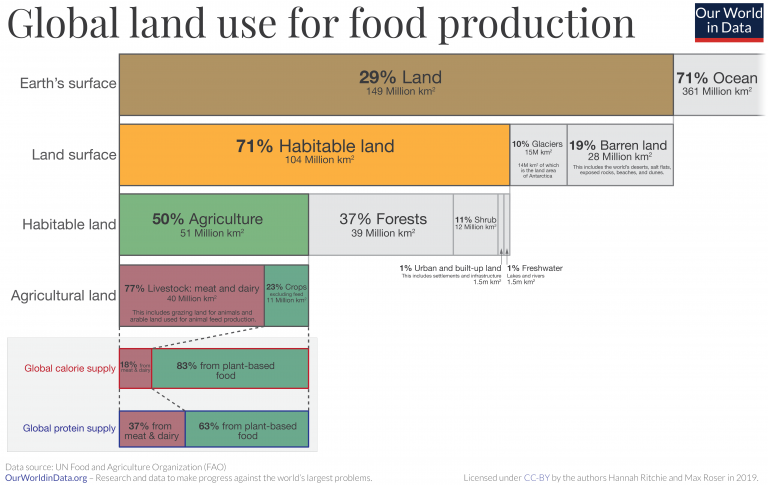
The other major threat is agriculture – first in terms of livestock competition and the diseases they bring, and also in terms of habitat loss. Globally we use half of all habitable land for agriculture. This expansion of pasture and cropland has come at the cost of forests and wild grasslands and has fragmented habitats that these species rely on. If we want to protect our large mammal species we need to make more land available for wildlife that is free from human encroachment. This means bringing deforestation to an end; reducing cropland expansion through improved yields, and reducing the amount of land we use for pasture so wild animals and livestock are not in conflict.
Most threatened mammals are in Africa and Asia
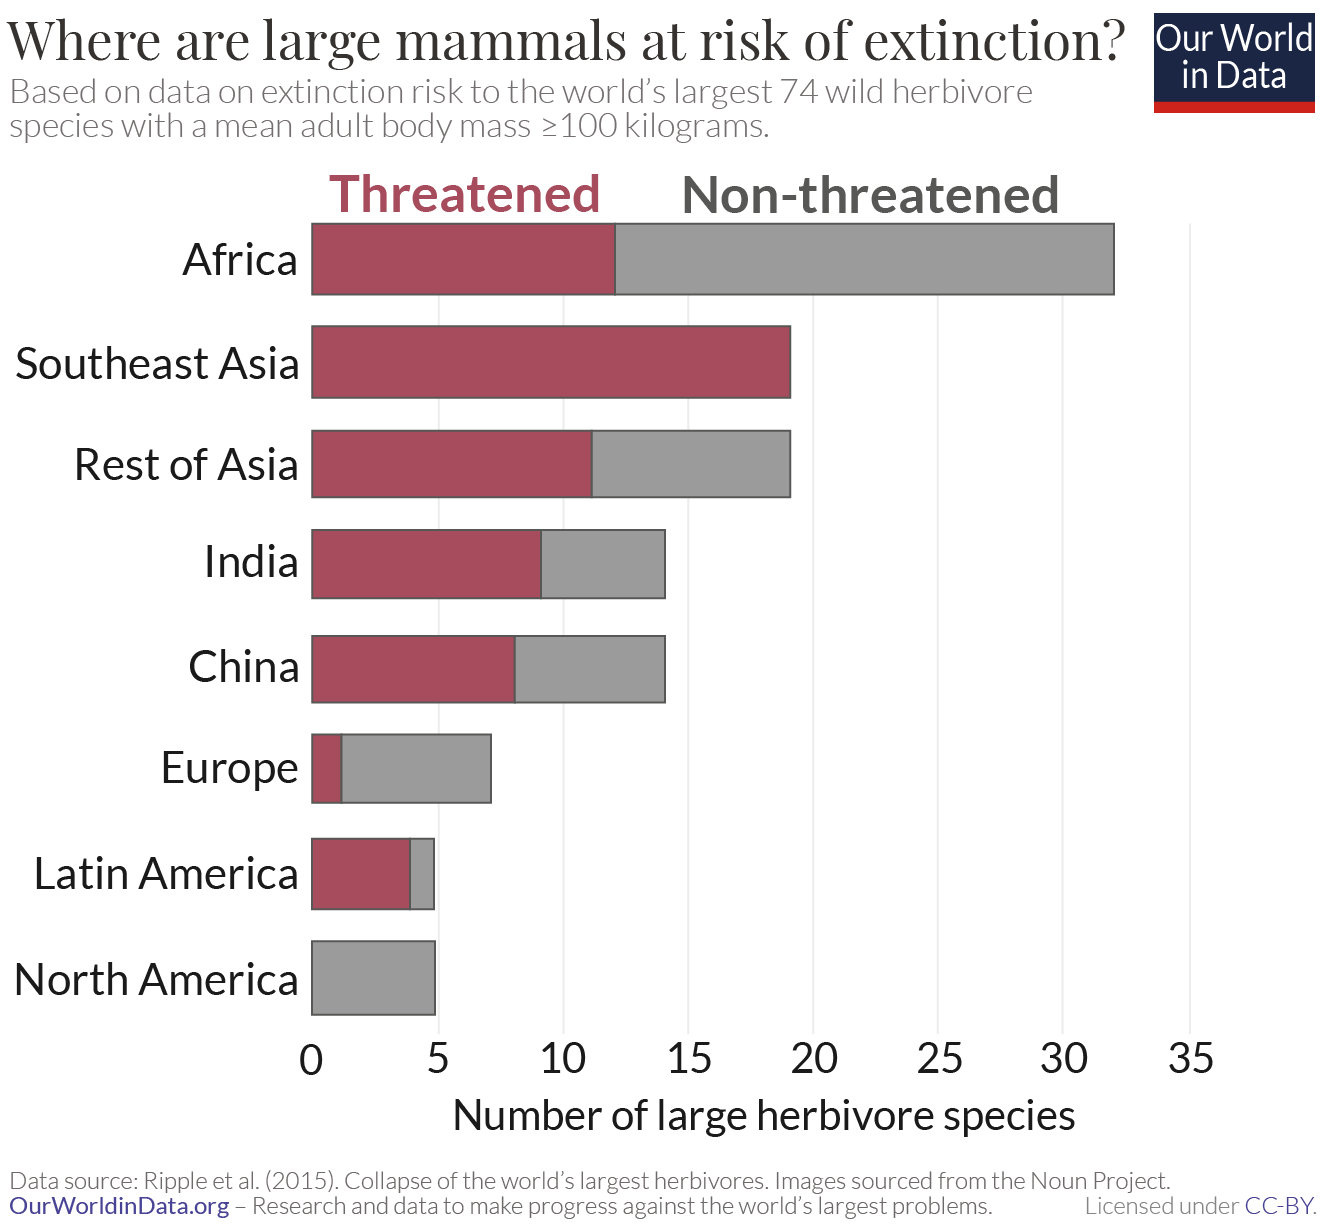
Humans had wiped out most large mammals in the Americas shortly after their arrival around 10 to 15,000 years ago. 83% of North and 72% of South America’s megafauna (mammals weighing more than 40 kilograms) went extinct.31 Today, they are home to much fewer large mammal species. North America has none that are threatened with extinction. However, continued deforestation, livestock competition, and poaching mean that 80% of large herbivore species in Latin America are threatened.
These threats extend across much of the tropics. Africa and Asia are both home to a large number of threatened species. One factor here is that they are particularly rich in mammal biodiversity. They have a lot of mammal species, and in particular, endemic species which means they occur naturally in only one country. Indonesia has the largest number of unique mammals, with 281 endemic species. It’s home to the last remaining Sumatran and Javan Rhinos. Madagascar is also rich in biodiversity; it has more than 200 endemic mammals.
So, the tropics are rich in biodiversity. But they’re also where pressures on wildlife are greatest. Illegal wildlife trade – the buying and selling of exotic species – is still booming across many countries in Africa and Asia today. Elephants, rhinos and gorillas are all poached for their body parts, and sold at a lucrative price. It’s not just direct hunting that’s putting these species at risk. As we saw above, habitat loss is also a major problem. 95% of deforestation today occurs in the tropics. Growing demands for food domestically, and commodities to sell in the global market, have led to continued expansion of land for agriculture.
Protecting the world’s largest mammals means bringing poaching, and deforestation to an end. Nearly all of this action will need to come from countries across the tropics.
Animal-specific trends
IN THIS SECTION
Elephants
Elephants are the world’s largest living land animals, weighing in at up to 7.5 tonnes.32 Their size – far from discouraging humans – has made them a prime target for poaching. History has shown us that it is usually the largest mammals that are most at risk from human hunting. Elephants are no different. We hunt them for their meat, their trunks, and their lucrative tusks.
There are around 450,000 elephants in the world today. But this is a tiny fraction of how many there used to be.
In this article we look at the state of elephant populations today, and how these populations have changed over time.
State of elephant populations today
| Elephant species | Population (latest estimate) | Extinction risk | Population trend |
| African elephant (Loxodonta africana) | 415,000 | By subspecies below | By subspecies below |
| African forest elephant (Loxodonta cyclotis) | Critically endangered | Decreasing | |
| African savanna elephant (Loxodonta africana) | Endangered | Decreasing | |
| Asian elephant (Elephas maximus) | 40,000 – 50,000 | Endangered | Decreasing |
There are two species of elephant: the African (with the official name Loxodonta africana) and Asian (Elephas maximus) elephant. If you want to tell the difference between them, look at their ears: the African elephant has much bigger ears, very similar in shape to the African continent; the Asian elephant has much smaller, rounded ears.33 Their tusks are also a useful indicator: both male and female African elephants can grow tusks, but only male Asian ones can.
In the table I have summarized the status of their populations today.
There are around ten times as many African than Asian elephants in the world. In 2015 there were around 415,000 African elephants left. For the Asian species, this is in the range of 40,000 to 50,000.
The Asian elephant is classified as ‘endangered’, one level down from ‘critically endangered’ before extinction, on the IUCN Red List.34 The African elephant was previously treated as a single species, but has recently been separated into the African forest elephant (Loxodonta cyclotis) and African savanna elephant (Loxodonta africana) for evaluation. The forest elephant is listed as ‘critically endangered’ and the savanna elephant as ‘endangered’. The populations of both species are declining.
Are elephant populations increasing or decreasing?
To understand if our elephant populations are in trouble, we don’t only need to know the number of animals alive today, but also the direction and rate of change. If population numbers are falling quickly, we should be concerned even if there are hundreds of thousands left.
Let’s take a look at the African and Asian elephant species one-by-one.
African elephant (Loxodonta africana)
There are ten times as many African elephants than Asian elephants in the world. That makes them seem abundant. But their numbers today are a tiny fraction of the past.
African elephant populations have shrunk by 98% since 1500. We see this in the chart which maps population estimates from 1500 through to 2015.35
In 1500, there were over 25 million elephants in Africa. By 1900 this had fallen to around 10 million, and by 1979 down to 1.3 million.
There was a rapid decline in population size over the 1970s and 1980s such that by the mid-1990s numbers had fallen below 300,000. Over the following decades, conservation efforts across some countries managed to restore populations to over 470,000 in 2008. But increased poaching rates over the past decade have sent numbers back into decline.
Another piece of evidence we have that populations have been in decline is data of the ‘carcass ratio’. During population surveys, researchers also count the number of dead elephants (carcasses). The carcass ratio is the number of dead elephants observed during surveys, counts as a percentage of the total population. In the chart we see the carcass ratio for many countries and the continent as a whole in 2015. Across Africa the carcass ratio was 11.9%.36 This means for every 100 elephants alive, there were around 12 dead elephants. A carcass ratio greater than 8% usually means the population is shrinking, because this will be greater than the replacement rate.37
The overall population of African elephants has been falling in recent years. But this varies significantly across countries. In some, the carcass ratio was very high: in Cameroon it was 83%; Mozambique 32%; and Angola 30%.
In the chart of elephant populations above, you can view trends by country. However, data is available only for the years 2007 and 2015. So even countries which show an increase in over this decade – Cameroon, for example – might have seen a decline in very recent years, which is reflected in carcass ratio data.
Asian elephant (Elephas maximus)
In contrast to the African Elephant, there are fewer estimates of Asian Elephant populations. This is more worrying because the Asian elephant is at a higher risk of extinction. We should be tracking these numbers more closely, not less.
But we do have some data for select countries, and some longer-term estimates.
The IUCN estimates that the total population of Asian elephants has more than halved over the past century. It estimates there were 100,000 individuals in the early 1900s; today that figure is in the range of 40,000 to 50,000.
Population data over time is available for some countries in Asia: the Indian government, for example, have published estimates periodically since 1970. In the map you can explore the latest population estimates from the Asian IUCN SSC Asian Elephant Specialist Group (AsESG) for each country. Where available, clicking on a country will show its change in population over time.
In India, populations have been steadily increasing since 1980, rising from around 16,000 to over 27,000 in 2017. This shows that it’s possible to protect these species and help their populations rebuild.
However, the lack of data over time for many countries makes it difficult to properly assess the health of Asian elephant populations overall.
How to save our elephant populations
By far the biggest threat to both the African and Asian elephant is poaching. Elephants are killed for their trunks, and their tusks. Ivory is a lucrative business.
It’s not just elephants that are under pressure. Poaching is the leading threat to all large mammals. But as we’ve seen from some country-level examples: protecting these species is possible: India has managed to protect and restore elephant populations. Namibia, Zimbabwe and Angola have also managed to turn the trend. In our follow-up article we will take a look at the scale of global poaching, and what we can learn from the countries that have been successful in bringing it to an end.
Rhinos
The largest mammals are at the greatest risk of extinction. This has been the case since the arrival of humans, and is still true today.
Weighing in at several tonnes, rhinos are some of the world’s largest mammals.38 With extravagant prices for rhino horns and body parts, they’re also one of the most threatened: four of the five rhino species are ‘critically endangered’.
In this article we take a look at the status of rhino populations today, and whether they are in decline or on the path to recovery. They offer us both stories of concern and reasons for optimism.
State of rhino populations today
There are five species of rhino. Africa is home to the White and Black Rhino. The remaining three – the Sumatran, Javan and Indian – exist in Asia.
Some of these species have dangerously low population levels. In the table I have summarized the status of each of these species.
The Sumatran and the Javan Rhino can now only be found in Indonesia. They are Critically Endangered with less than 100 individuals left in the wild. The Black Rhino, despite having a population in the thousands, is also Critically Endangered. It experienced a rapid decline over the 20th century as we will see later.
The Indian (Greater One-Horned) offers us an important success story; it has seen a significant recovery in recent decades. The White Rhino too has shown an impressive recovery. But it has a dark side: the Southern White Rhino might be doing well but the Northern sub-species is on the brink of extinction. There are only two Northern White Rhinos left, and both of them are female.
Are rhino populations increasing or decreasing?
The health of these rhino populations is not just determined by how many animals are left today. The direction and pace that these populations are changing matters too.
For each species I have built a time-series of populations globally and by country. This data is aggregated from multiple sources: the main one being the African and Asian Rhino Specialist Groups (AfrSG) and TRAFFIC, which collate statistics on all rhino populations, and submit them to the IUCN.39
Let’s take a look at each of the five species one-by-one.
White rhino (Ceratotherium simum)
Overall, the story of the White rhino is a positive one. But this tale also has a darker side. There are two main subspecies: the Northern White and Southern White rhino. A century ago, the Northern was much more abundant than the Southern. Now the opposite is true.
In the chart we see the population trend of the Southern White Rhino. It’s touted as one of the world’s greatest conservation success stories.40 We don’t have precise estimates but it’s reported that by the mid-19th century it was still abundant. However, intense poaching by the Europeans and killings in the conversion of land for agriculture meant that by the late 19th century it was close to extinction. By 1900 there were only 20 left. All were in the Hluhluwe–iMfolozi Park in South Africa – now a nature reserve.
Over the course of the 20th century, severe protection of these species – particularly in African nature reserves – led to a significant and rapid increase. Populations were restored to more than 21,000. Numbers grew 1000-fold within a century.
Over the last few years, increases in poaching rates (which we cover here) have unfortunately led to another decline. South Africa is home to around three-quarters of Southern White Rhinos. You can explore population estimates by country in the chart.
If the story of the Southern White Rhino is one of our greatest successes, the story of its Northern cousin must be one of our biggest failures. The Northern White Rhino is on the brink of extinction. There are only two individuals left. Both are female.
In the chart we see its demise over the second-half of the 20th century. In 1960, it’s estimated there were more than 2,000, predominantly in Sudan and the Democratic Republic of Congo. Intense poaching, and challenges for protection during civil unrest in stronghold countries, has led to a rapid decline.
Sudan, the last remaining male died in Kenya in 2018. There are now only two female rhinos left: Najin and her daughter, Fatu. Both are guarded in a semi-wild enclosure, and have had their horns sawed off to deter poachers. Scientists are investigating ways to continue reproduction from the last females, including stem cell treatment and hybrid embryos from Northern White Rhino eggs and Southern White Rhino sperm.41 In 2021, researchers aim to implant embryos in both to try to get them to reproduce. Scientific innovation is now the only way to save these sub-species. Even if reproduction is successful, population numbers will be incredibly low for a long time. They will have to be closely guarded for a long time.
Black Rhino (Diceros bicornis)
The story of the Black Rhino is similar to that of the Northern White. The once abundant species has seen a dramatic decline over the 20th century.
Even after intense poaching by European settlers over the 19th and early 20th centuries, in 1960, there were still around 100,000 Black rhinos in Africa.42 The decline followed was rapid and dramatic: the number fell by more than 80% in only two decades. The population reached its low point in the early 1990s at around 2,500 and has since begun to recover. The number of Black Rhinos has more than doubled to more than 6,487. Nonetheless, continued poaching has still limited population growth in recent decades. The Black Rhino is still classified as Critically Endangered.43
Indian / Greater One-Horned Rhino (Rhinoceros unicornis)
The Indian (also called the Greater One-Horned) Rhino provides one success story in restoring wild mammals.
By the mid-20th century, there were very few Indian Rhinos left in the world. It’s estimated (with larger uncertainty since it predates regular surveying) that there were only 40 individuals left.
Since the mid-1960s, populations have increased nearly 100-fold. The latest estimates, taken in 2018, suggest there are now over 3,500 rhinos in the wild. This was the result of impressive conservation efforts to reduce poaching in both India and Nepal.
Unsurprising based on the name, India is home to more than 80% of the species. But Nepal also has a steady population. With only a few being spotted in recent decades, they are thought to now be extinct in Pakistan.
Javan Rhino (Rhinoceros sondaicus)
The Javan Rhino is one of the world’s most endangered mammals. There were only 66 rhinos left in 2018.44 This makes it Critically Endangered.
In the chart you see how Javan Rhino populations have changed over time.
In recent decades it has existed in two countries: Indonesia and Vietnam. But by 2010 it had gone extinct in Vietnam. Indonesia is now its only remaining home.
Its total population has, however, increased from 50 years ago. In the 1960s there were only 20 to 30 Javan Rhinos left in the world. From then until the 1990s, the population approximately doubled. Over the last few decades, populations have fluctuated around 40 to 70.
Sumatran rhino (Dicerorhinus sumatrensis)
Like the Javan species, Sumatran rhinos are also one of the most endangered mammals. They’re Critically Endangered. There were only 59 left in the world in 2018.45
In the chart you can see how its population has changed over time.
Once found in both Malaysia and Indonesia, the Sumatran Rhino is thought to be extinct in Malaysia; none have been recorded in 2016 and 2018 surveys.
But in contrast to the Javan, the number of Sumatran Rhinos in the world has been falling in recent decades, from 600 individuals in the mid-1980s to around one-tenth of that figure today. Both Malaysian and Indonesian rhino populations have contributed to this loss.
How do we protect rhino populations?
The biggest threat to rhinos is poaching. Rhino horns are still seen as luxury goods and can sell for a lot of money in illegal wildlife markets.
But rhinos are not the only species at risk from poaching. It’s the leading threat for most large mammals. But some success stories – such as the restoration of Southern White and Indian Rhino populations – shows us that their demise is not inevitable. With the right approach we have the opportunity to turn things around. In a follow-up article we will look at the scale of global poaching, and what we can learn from the countries that have been successful in bringing it to an end.
Whales
Weighing in at over 150 tonnes, Blue Whales are the largest animal to have lived on Earth. But their size hasn’t protected them from human exploitation. In fact, their size made them an incredibly valuable source of oil, meat and blubber. This fat gave us a rich fuel for energy and many other industrial uses.
Human hunting has resulted in a massive decline in global whale populations. Some have been pushed to the brink of extinction. But, as we will see, a combination of technological change, economic incentives and international policies have brought global whaling to very low levels. While some populations are still very small, we have been successful in preserving these beautiful animals.
Early whaling in the United States
Whaling is a practice that dates back to Medieval times; fortunately at low levels, meaning this early practice had little impact on whale populations.46
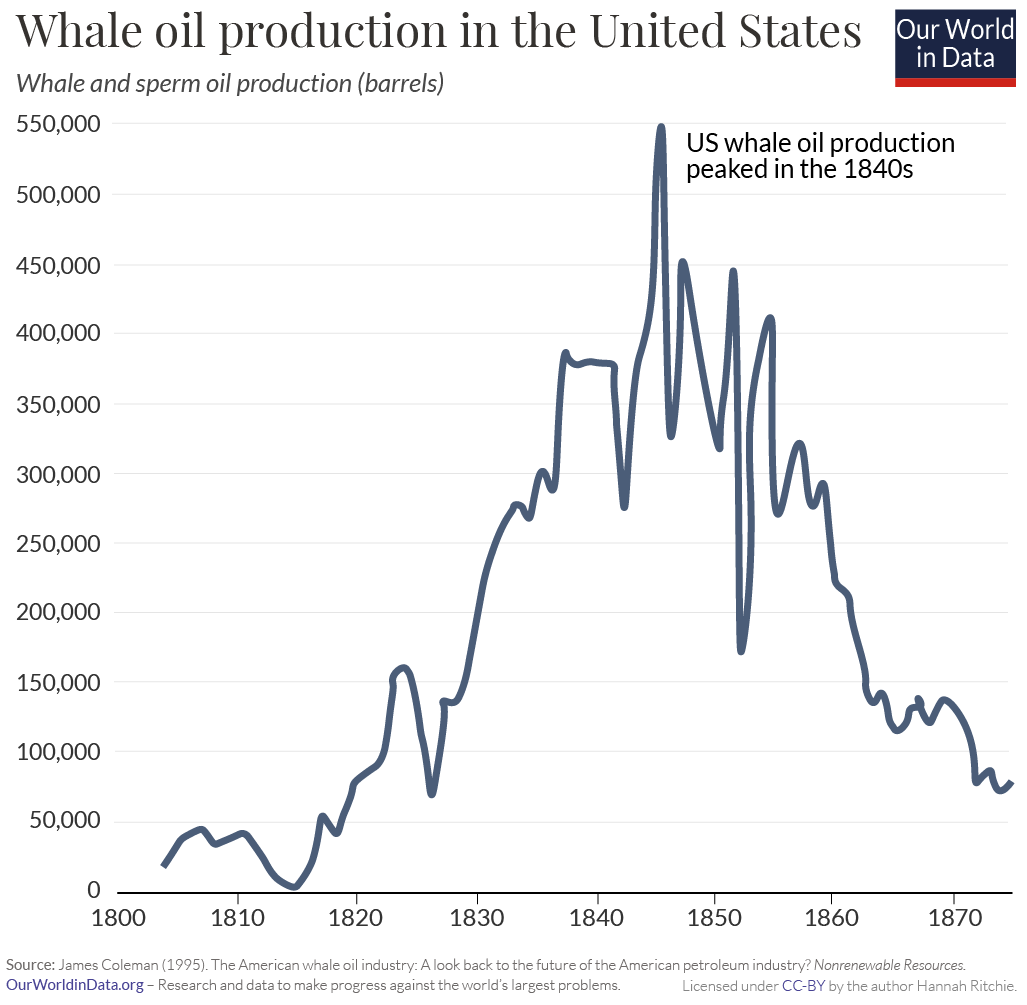
While global whaling was a feature of the 1900s, the peak of whaling in the United States was a century earlier. In the 18th and 19th centuries, whaling was a key industry in the US. Although the uses of whale oil later diversified, Americans mainly used it for lighting. Whale oil was used for the lighting of not only homes but also outdoor street lighting, lighthouses and miner’s headlamps – a range of uses that had a big impact on civilization during that period.47
As we see in the chart, US production of whale and sperm oil followed the classic inverted-U curve, peaking in the mid-19th century. At this point petroleum oil had been discovered, and kerosene – which was cheaper than whale oil – began to replace it in lighting. As whale hunting became increasingly unprofitable, production soon declined.48
Modern whaling reduced populations fell by two-thirds; Blue Whale populations fell by 98.5%
While the United States dominated whaling during the 19th century, it didn’t really reach the global stage until the 20th century.
Towards the end of the 1800s, new technologies were being developed that could catch whales in much larger numbers. Rather than the classic sail- or oar-powered boats that the Americans had been using, the Norwegians developed mechanized, steam-powered vessels with cannons and harpoons. This made whaling much more efficient. Not only could we catch more whales, it also allowed us to catch species – like Blue and Fin Whales – that were too fast for our old technologies.
This marked the start of the ‘modern’ whaling era, from around 1890 onwards. It had a dramatic impact.
Whale populations fell by two-thirds in just over a century.49 In the chart we see the change in global whale numbers before this ‘modern whaling’ period versus the turn of the millennium. In 1890 there were around 2.56 million whales in our oceans. By 2001 there were only 880,000 left.
Not all species were impacted equally. Some of the largest – the Blue and Fin Whale in particular – were prime targets. This meant that the decline of total biomass of whales over this period was even greater. It fell by 84% – from 103 million tonnes to just 16 million tonnes of carbon.
We see this discrimination towards particular species in the chart. All species declined, but the extent was wildly different. The Minke Whale saw a fall of just 20%.50 The Blue Whale was almost plundered into extinction. Its populations fell from 340,000 to just 5,000. A reduction of 98.5%.51 The Fin Whale lost 85% of its numbers.52
The rise and fall of whaling
The 20th century didn’t only bring technological innovations on how to track and hunt whales, it also brought advances on how we could use the oils, blubber, and bone that they provided. Both demand and supply rocketed.
Whale oils were initially used for lighting, but their market soon expanded. Sperm oil is special because it maintains its lubricating qualities at very high temperatures – this made it a vital ingredient for machinery, engines, guns and watches during the Industrial Revolution. Advancements in cosmetics and food chemistry meant that its by-products were soon used for soaps, textiles, and even margarine. Ambergris – a substance found in the intestine of sperm whales – was, and still is, used to make perfume. You will find it in the luxury perfume, Chanel No.5. Whales made it into the fashion industry too. Instead of teeth, baleen whales have long strips of keratin (the substance found in human nails and hair) which hang from their mouths – these plates were used in everything from skirts and women’s corsets, to umbrellas, parasols, fishing poles and crossbows.53
In the chart we see how this rising demand for whale products affected hunting rates across the world. This shows the number of whales killed each year, from 1900 onwards. For decades, tens of thousands of whales were killed each year. Only World War II gave these animals some reprieve – notice the drop in kills during the early-1940s.
At its peak in the 1960s, we were hunting 80,000 whales every year.
It didn’t go unnoticed that this rate of whale catch was unsustainable. In fact, a number of countries formed the International Whaling Commission (IWC) in 1946 to work out how to manage international whaling stocks. Quotas were introduced, but countries weren’t adhering to them.54 Whaling rates continued to rise, even after the lull of World War II. By the mid-20th century, many species were pushed to the brink of extinction.
Whaling peaked in the 1960s – how did the world tackle this?
By the mid-20th century, the prospects for whales was looking bleak. And yet, the world managed to turn things around.
In the chart we see the number of whales killed per decade. We see a gradual rise over the first half of the century – with the exception of the war-stricken 1940s – with whale catch reaching its peak in the 1960s. 703,000 whales were killed during the 1960s. But, we see a decline since then. What caused this?
There were a number of factors at play. By the 1960s, whale populations had become increasingly depleted – this scarcity had an impact on the economic incentives to hunt them. Whales were becoming harder to find and catch. Technological advances also meant that substitutes for whale oil and bone in the cosmetic, food and textile industries were becoming cheaper and more accessible. The whaling industry was losing its profitability.
There was another massive policy change in the 1980s. More and more countries were becoming members of the International Whaling Commission. In the map we see the timeline by which countries joined the IWC. After many decades of failed quota agreements, the IWC agreed to a global moratorium. This made commercial whaling illegal, with only a few exceptions.55 This came into action in 1987, and we see a dramatic drop-off in whale catch in the decades since then.
You will notice that we haven’t eliminated whaling completely. Some countries – such as Japan, Norway and Iceland – have resumed limited whaling outside the guidelines of the IWC.56 In 2019, Japan withdrew from the international agreement. These countries typically hunt species that are not considered to be critically endangered.
Some species will still take many decades to recover. Populations of North Atlantic right whale, the Arctic bowhead, and the Pacific blue whale are still critical. Yet the story of whaling overall is a conservation success: an animal that was once in high demand across the world has been saved from extinction through substitution and international cooperation. Many species are in a similar position to whales in the 1960s. But the decline of whaling should give us hope that we can turn things around once again.