
Summary
- We often think of environmental damage as a modern problem, but humans have been transforming the planet for millennia.
- Human expansion led to the Quaternary Extinction – the extinction of more than 178 species of the world’s largest mammals – more than 10,000 years ago.
- Human transformation of global land use accelerated rapidly with the advent of agriculture around 12,000 years ago.
- Humans very quickly became the dominant land user, reaching 5% of land use around the year 900; 10% by 1700; 25% by 1880; up to half of all land today.
- The world has lost one-third of its forests since the last ice age.
- Deforestation peaked in the 1980s, but the tropics are still losing forests.
- Since agriculture is the dominant driver of habitat loss, we need to use less land for food. We can achieve this through dietary changes (less livestock) and improved yields.
Human impacts have accelerated, but we have been transforming the planet for millennia
- Did humans cause the Quaternary Megafauna Extinction?
- Wilderness to farm: how humans have transformed the global landscape
- Country-by-country: how agriculture spread across the world
Humans have had such a profound impact on the planet’s ecosystems and climate that Earth might be defined by a new geological epoch: the Anthropocene (where “anthro” means “human”). Some think this new epoch should start during the Industrial Revolution, and some at the advent of agriculture 10,000 to 15,000 years ago. This feeds into the popular notion that environmental destruction is a recent phenomenon.
The lives of our hunter-gatherer ancestors are instead romanticized. Many think they lived in balance with nature, unlike modern society where we fight against it. But when we look at the evidence of human impacts over millennia, it’s difficult to see how this was true.
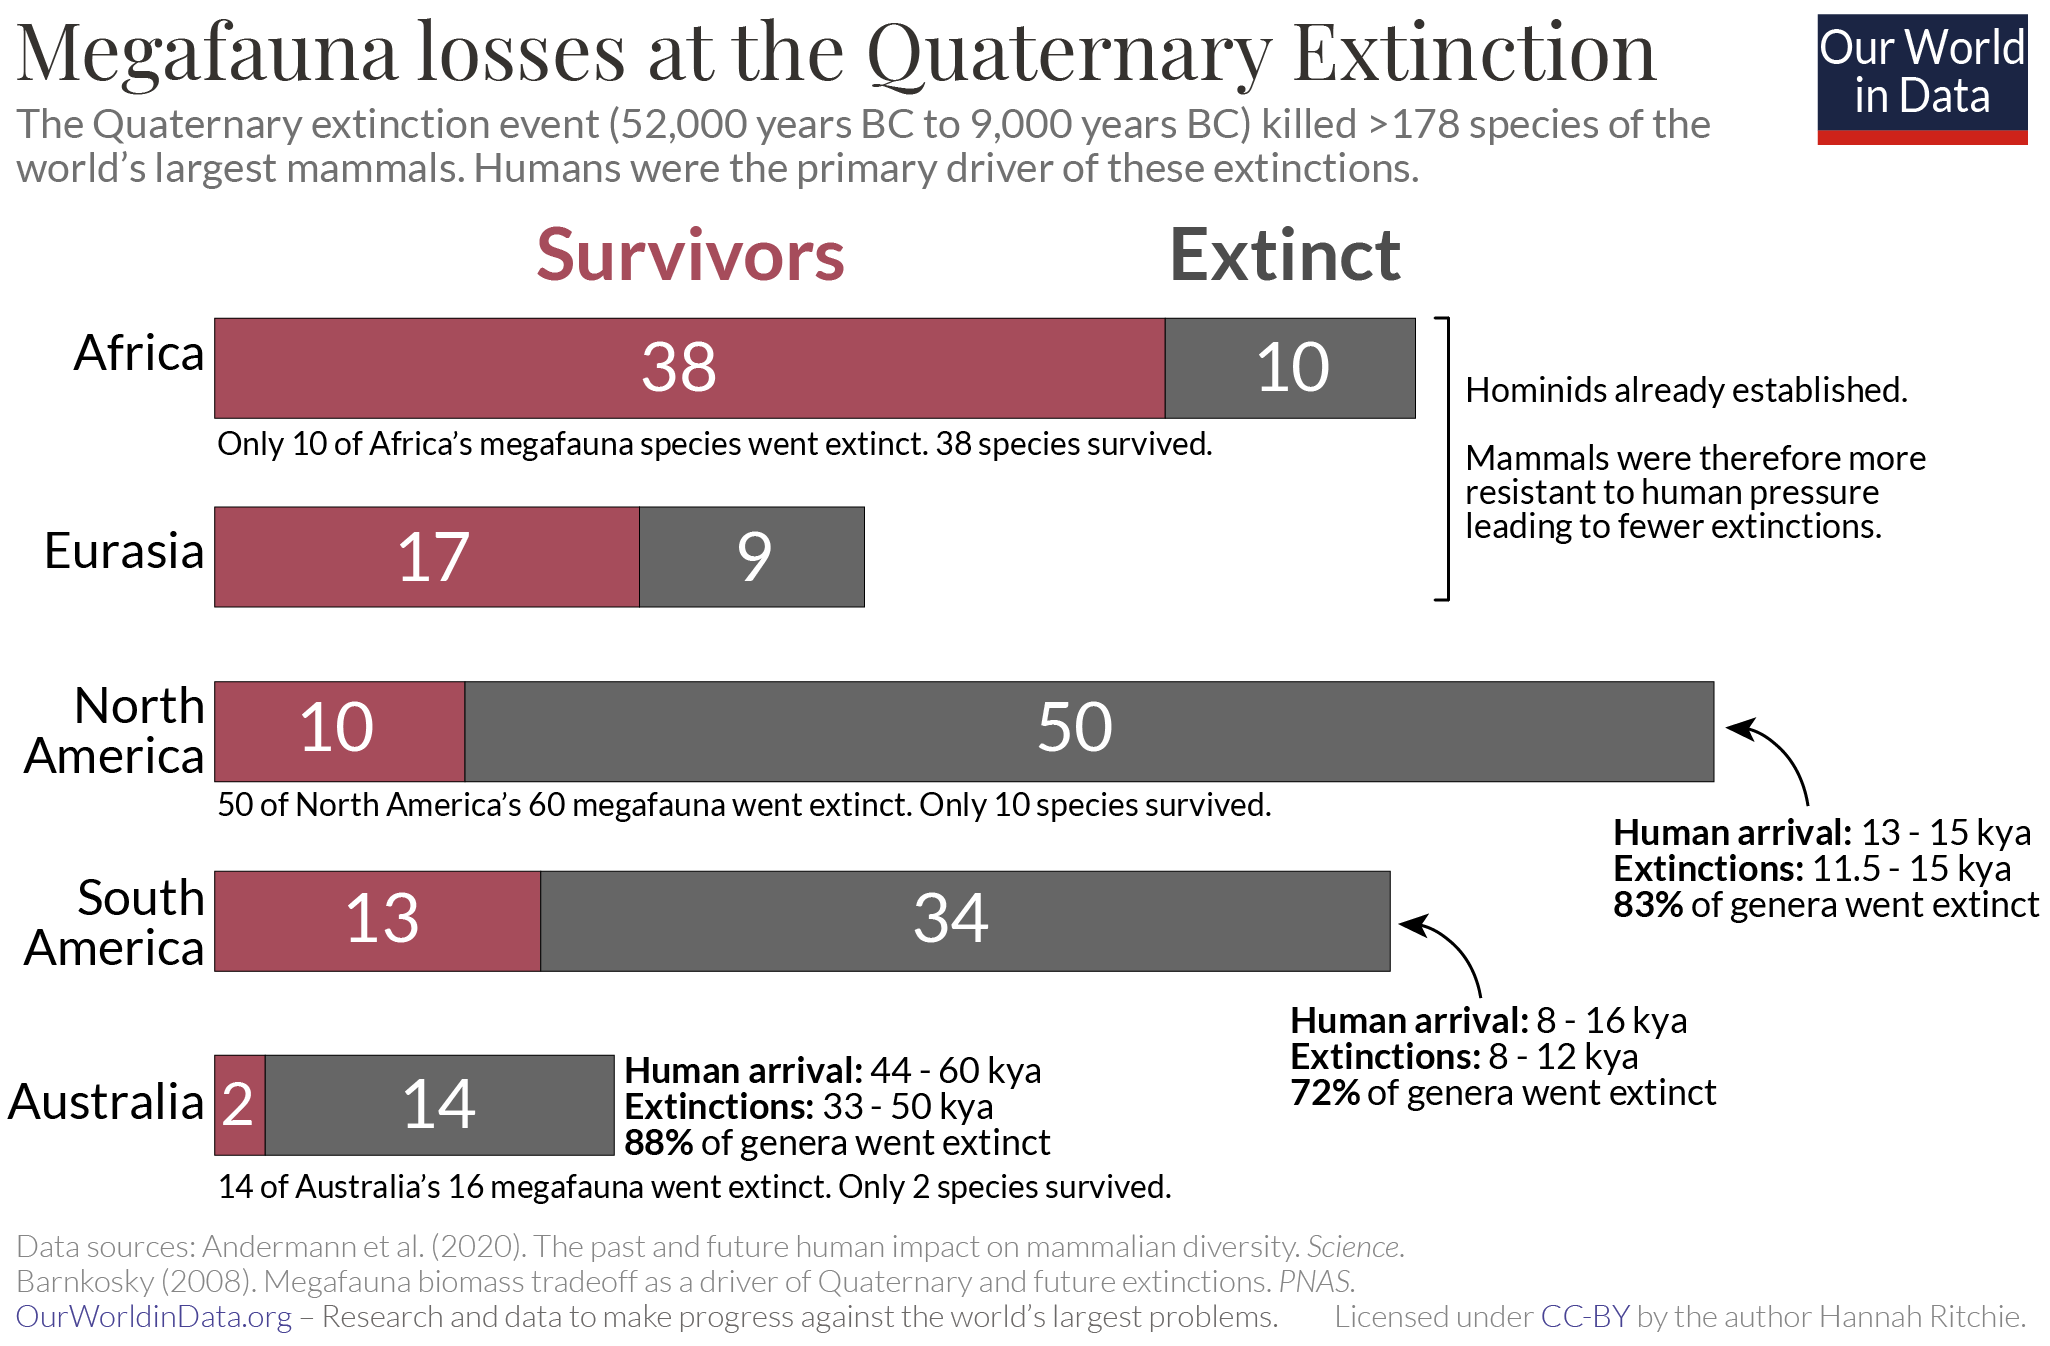
Our ancient ancestors drove more than 178 of the world’s largest mammals (‘megafauna’) to extinction. This is known as the ‘Quaternary Megafauna Extinction’ (QME). The extent of these extinctions across continents is shown in the chart. Between 52,000 and 9,000 BC, more than 178 species of the world’s largest mammals (those heavier than 44 kilograms – ranging from mammals the size of sheep to elephants) were killed off. There is strong evidence to suggest that these were primarily driven by humans – we look at this in more detail later.
Africa was the least hard-hit, losing only 21% of its megafauna. Humans evolved in Africa, and hominins had already been interacting with mammals for a long time. The same is also likely to be true across Eurasia, where 35% of megafauna were lost. But Australia, North America, and South America were particularly hard-hit; very soon after humans arrived, most large mammals were gone. Australia lost 88%; North America lost 83%; and South America, 72%.
Far from being in balance with ecosystems, very small populations of hunter-gatherers changed them forever. By 8,000 BC – almost at the end of the QME – there were only around 5 million people worldwide. A few million killed off hundreds of species that we will never get back.
Did humans cause the Quaternary Megafauna Extinction?
The driver of the QME has been debated for centuries. Debate has been centered around how much was caused by humans and how much by changes in climate. Today the consensus is that most of these extinctions were caused by humans.
There are several reasons why we think our ancestors were responsible.
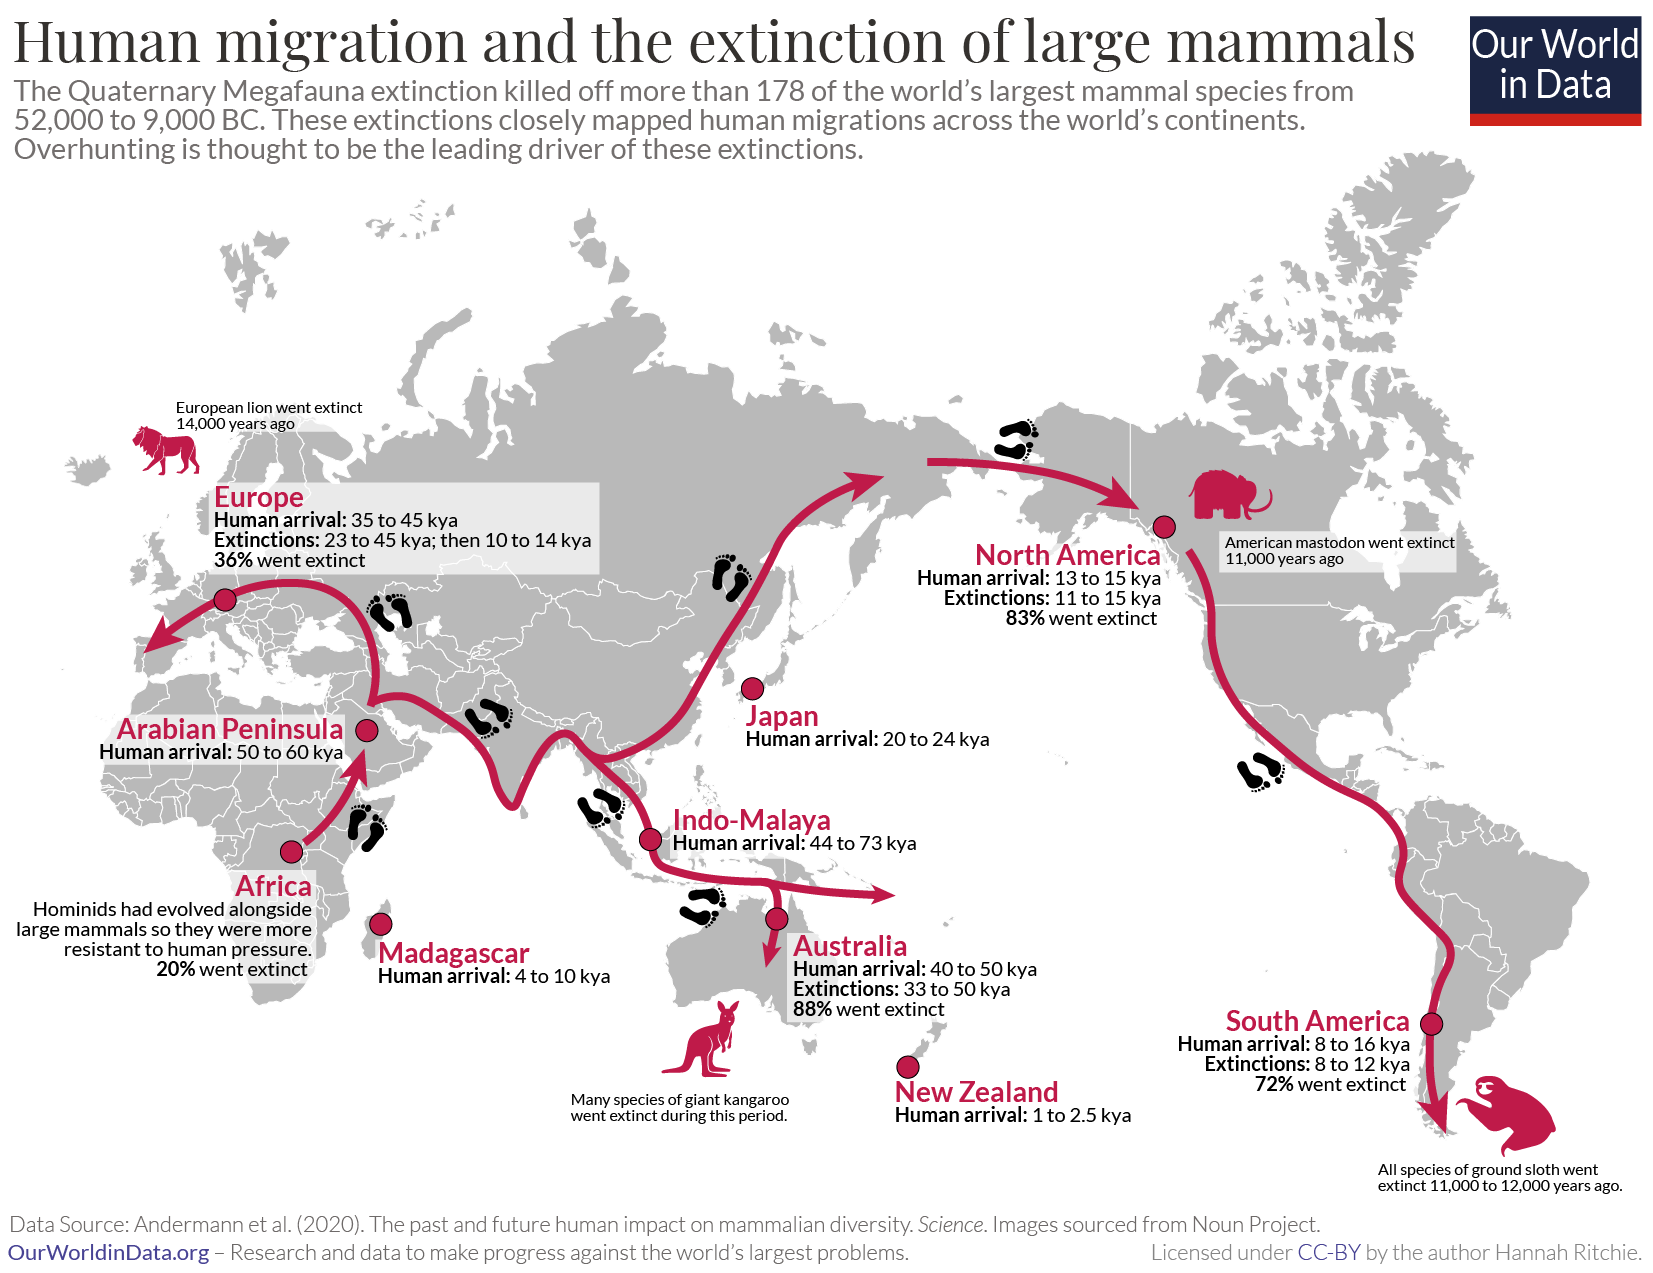
Extinction timings closely match the timing of human arrival. The timing of megafauna extinctions was not consistent across the world; instead, their demise coincided closely with the arrival of humans on each continent. The timing of human arrivals and extinction events is shown on the map.
Humans reached Australia somewhere between 65 to 44,000 years ago.1 Between 50 and 40,000 years ago, 82% of megafauna had been wiped out. It was tens of thousands of years before the extinctions in North and South America occurred. And several more before these occurred in Madagascar and the Caribbean islands. Elephant birds in Madagascar were still present eight millennia after the mammoth and mastodon were killed off in America. Extinction events followed in man’s footsteps.
Significant climatic changes tend to be felt globally. If this extinction were solely due to climate, we would expect them to occur at a similar time across the continents.
QME selectively impacted large mammals. There have been many extinction events in Earth’s history. There have been five big mass extinction events and a number of smaller ones. These events don’t usually target specific groups of animals. Large ecological changes tend to impact everything from large to small mammals, reptiles, birds, and fish. During times of high climate variability over the past 66 million years (the ‘Cenozoic period’), neither small nor large mammals were more vulnerable to extinction.2
The QME was different and unique in the fossil record: it selectively killed off large mammals. This suggests a strong influence from humans since we selectively hunt larger ones. There are several reasons why large mammals in particular have been at greater risk since the arrival of humans.
Islands were more heavily impacted than Africa. As we saw previously, Africa was less heavily impacted than other continents during this period. We would expect this since hominids had been interacting with mammals for a long time before this. These interactions between species would have impacted mammal populations more gradually and to a lesser extent. They may have already reached some form of equilibrium. When humans arrived on other continents – such as Australia or the Americas – these interactions were new and represented a step-change in the dynamics of the ecosystem. Humans were efficient new predators.
There have now been many studies focused on the question of whether humans were the key driver of the QME. The consensus is yes. Climatic changes might have exacerbated the pressures on wildlife, but the QME can’t be explained by climate on its own. Our hunter-gatherer ancestors were crucial to the demise of these megafaunas.
Human impact on ecosystems, therefore, dates back tens of thousands of years, despite the Anthropocene paradigm that is this a recent phenomenon. We’ve not only been in direct competition with other mammals, but we’ve also reshaped the landscape beyond recognition. Let’s take a look at this transformation.
Wilderness to farm: how humans have transformed the global landscape
Over the past 12,000 years, humans have reshaped the world’s landscape from wilderness to farm. Our hunter-gatherer ancestors had a profound impact on other mammals, and minor impacts on land use through burning fires to clear land. But it wasn’t until the advent of agriculture that global land use really started to change.
Researchers at the History Database of the Global Environment (HYDE) reconstruct historical land use patterns dating back millennia. The most recent reconstruction by Erle Ellis, Arthur Beusen, and Kees Klein Goldewijk is shown in the chart.3
In 10,000 BC, 40% of Earth’s surface was completely wild and free from human influence – this consisted of pristine, untouched forests, wild grasslands, shrubs, and deserts. By this point, at least 60% had been touched by humans in some way, here classified as ‘semi-natural land’. Semi-natural lands were inhabited but with only minor use for settlements or agriculture.
We began to see the first lands for pasture [with the beginnings of pastoralism, as we will see later] in 8,000 BC. Croplands appeared around 7,000 BC, followed by the rise of villages – densely populated agricultural settlements – around 6,000 BC.
Land used for farming – pasture and croplands – plus villages and, much later, urban land, are collectively referred to as ‘used’ enthrones. It wasn’t until around 1,000 BC that ‘used’ enthrones reached 1% of Earth’s land. At this point, agriculture and human settlements were present across Mediterranean Europe, the Middle East, Africa, and East Asia.
Humans quickly became the dominant land user, reaching 5% of land use around the year 900; 10% by 1700; 25% by 1880; up to half of all land today.4
This came at an obvious cost to Earth’s ecosystems. We’ve lost one-third of all forests over the last 10,000 years. Wild grasslands and other natural habitats have been lost. And over the last few centuries, more than half of semi-natural lands (with very sparse human influence) have become intensified.
Human demands for agriculture have transformed the global landscape. This has been a transition that dates back millennia but has accelerated in recent centuries. To see how and where these changes occurred, let’s look at how agriculture spread across continents.
Country-by-country: how agriculture spread across the world
We’ve looked at the rise of global agriculture. But we’ve yet to see when and where these changes occurred.
To understand the history of populations and land use across the world, researchers built the ArchaeoGLOBE Project, a crowdsourcing approach that draws on archaeological expert knowledge country by country. Drawing on responses from 255 archaeologists with knowledge across 146 regions, Lucas Stephens et al. (2020) built a global picture of the extent and timing of foraging; pastoralism (animal agriculture); extensive and intensive agriculture; and urbanization.5 This dates back 10,000 years ago through to 1850.
Here they categorize land use across five categories:
Foraging: this includes the practices of foraging for foods such as fruit and wild plants, hunting and gathering wild animals, and fishing. It’s analogous to hunter-gatherers.
Pastoralism: this involves the management and raising of livestock, including cattle, goats, sheep, chickens, pigs, etc.
Extensive agriculture: this is where farmers grow crops but not continuously on the same plot of land. It includes farming approaches such as ‘slash-and-burn’ or ‘shifting cultivation’, where communities clear land to grow crops, then abandon it to move elsewhere or leave it for several years to regenerate.
Intensive agriculture: this is continuous cultivation that is common in farming approaches in most high- and middle-income countries today. Cropland is managed year-round, and annual harvests occur on the same plot of land.
Urbanization: the shift from rural areas with low population density to population-dense urban centers.
The extent of these land uses was defined as ‘minimal’ (less than 1% of land area), ‘common’ (1 to 20% of land area), or ‘widespread’ (more than 20%).
In the maps, we see the transition points for each of these land uses across the world. You can use the timeline at the bottom of each interactive chart to see how land uses have changed over the course of millennia. For foraging, pastoralism, and extensive and intensive agriculture, the transition dates from none to minimal, joint; then widespread use is shown. Urbanization, it’s the onset date of when cities became present.
Ten thousand years ago, foraging was still common across all regions. We shouldn’t underestimate the impact that these practices had on some ecosystems. Beyond the significant decline in large mammals that we discussed earlier, hunter-gatherers had long-lasting implications on many ecosystems even before the domestication of livestock and crops. Widespread use of fire increased greenhouse gas emissions and altered water and vegetation cycles.
As we see, foraging communities shifted towards pastoralism and extensive agriculture in Southwest Asia and the Mediterranean as early as 10,000 years ago. By 8,000 to 6,000 years ago, it had become commonplace. Pastoralism was particularly useful in arid regions where dry conditions made growing crops much more difficult. It spread faster than extensive agriculture, becoming common across Northern Africa and Central Asia by 4,000 BP. Southern Africa and Eurasia soon followed – embracing livestock before crop farming became common.
It wasn’t until 3,000 years ago that extensive agriculture was more common globally than pastoralism. From there, extensive and then intensive agriculture continued to spread. Intensive farming (continuous cultivation of crops year after year) was constrained by climate to only a few regions – the Mediterranean, Southwest Asia, South Asia, and eastern China – until 2,000 years ago. But since then, it has rapidly become widespread across most of the world today.
Across most of the world, urbanization is a relatively recent phenomenon, playing only a minor role until the last few centuries. But some regions – across the Mediterranean, Central and Eastern Asia, and parts of Europe had their first cities thousands of years ago.
These maps show the spread of livestock and crop farming across the world. They represent the dispersal and growth of human populations and continued efforts to feed themselves. What’s hidden is the massive environmental changes occurring at every transition. As we saw earlier from the long-term changes in global land use, the expansion of agriculture came at the expense of forests and wild grasslands; and the rise of livestock created direct competition with other species.
To move forward, we need to use less land for food, not more
Humans have been reshaping the planet for millennia. Food lies at the heart of this change: what we eat and how we get it. Earth has been transformed from a diverse wilderness to a giant man-made farm.
If we want to give the land back to nature, we need to reduce the amount of land we use for agriculture. While modern, intensive agriculture often gets a bad reputation, it has been integral to sustaining our population today while saving land. Massive crop yields increase means per capita land use for food today is much smaller than in the past.
To move forward, we need this to continue: further crop yields, less meat and dairy to reduce our demand for pasture, and more productive or selective livestock systems for the meat and dairy we eat. Moving backward towards low-density extensive agriculture or hunter-gatherer food production doesn’t work. Rather than making space for natural ecosystems to regenerate, they would continue robing more species of their habitats.
Forest loss and deforestation
IN THIS SECTION
- The world has lost one-third of its forests, but an end to deforestation is possible.
- Global deforestation peaked in the 1980s. Can we bring it to an end?
The world has lost one-third of its forests, but an end of deforestation is possible.
Many people think of environmental concerns as a modern issue: humanity’s destruction of nature and ecosystems as a result of very recent population growth and increasing consumption. This is true for some problems, such as climate change. But it’s not the case for deforestation. Humans have been cutting down trees for millennia.
How much forest has the world lost? When in history did we lose it?
In the chart, we see how the cover of the earth’s surface has changed over the past 10,000 years. This is shortly after the end of the last great ice age, through to the present day.6
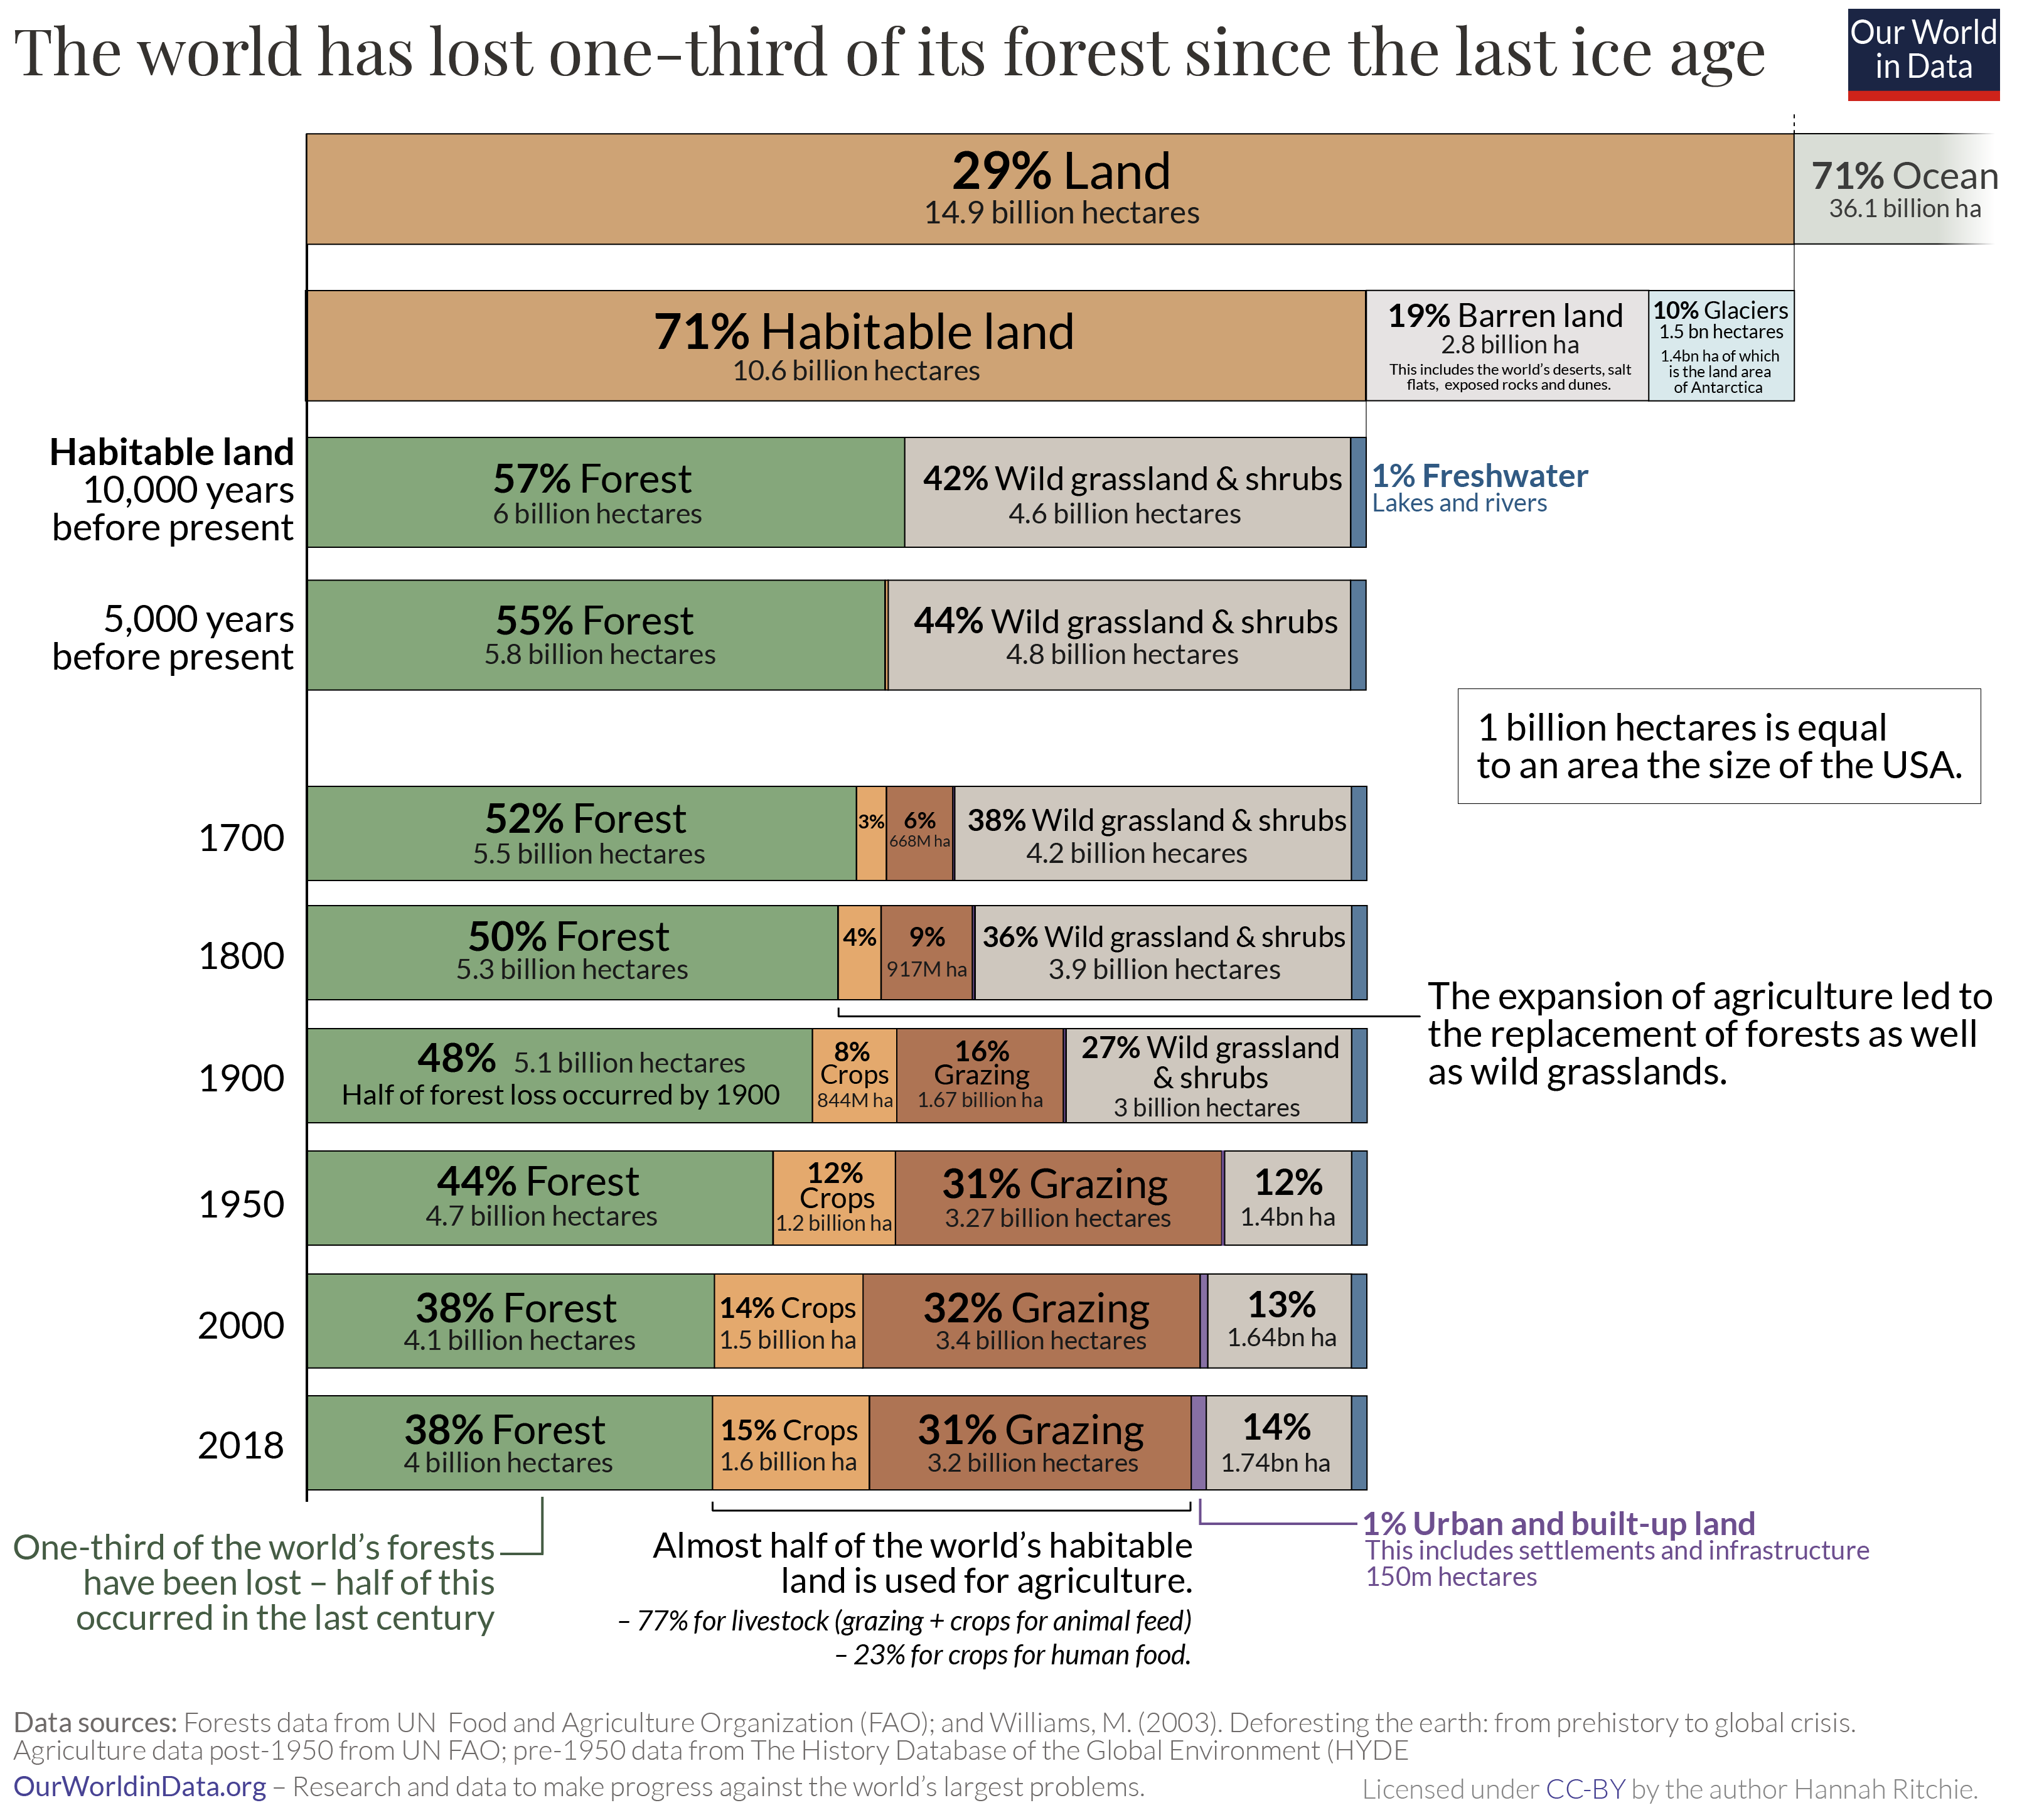
Let’s start at the top. Of the 14.9 billion hectares of land on the planet, only 71% of it is habitable – the other 29% is either covered by ice and glaciers or barren land such as deserts, salt flats, or dunes. I have excluded these categories to focus on how habitable land is used.
The bar chart below shows the earth’s surface cover just after the end of the last ice age.7 10,000 years ago, 57% of the world’s habitable land was covered by forest. That’s 6 billion hectares. Today, only 4 billion hectares are left. The world has lost one-third of its forest – an area twice the size of the United States.
Only 10% was lost in the first half of this period, until 5,000 years ago. The global population at this time was small and growing very slowly – fewer than 50 million people worldwide. The amount of land per person that was needed to produce enough food was not small – in fact, it was much larger than today. But a small global population meant little pressure on forests to make space for land to grow food and as wood for energy.
Fast-forward to 1700, when the global population had increased more than ten-fold, to 603 million. The land used for agriculture – land to grow crops and grazing land for livestock – was expanding. You will notice in the chart that this was expanding into previously forested land and other land uses such as wild grasslands and shrubbery. Still, more than half of the world’s habitable land was forested.
The turn of the 20th century is when global forest loss reached the halfway point: half of the total forest loss occurred from 8,000 BC to 1900; the other half occurred in the last century alone. This emphasizes two critical issues.
First, it reiterates that deforestation is not a new problem: relatively small populations of the past could drive a large amount of forest loss. By 1900, there were 1.65 billion people in the world (five times fewer than we have today), but for most of the previous period, humans were deforesting the globe with only tens or hundreds of millions. Even with the most basic of lifestyles compared to today’s standards, the per capita footprint of our ancestors would have been significant. Low agricultural productivity and reliance on wood for fuel meant that large amounts of land had to be cleared for introductory provisions.
Second, it clarifies how much deforestation has accelerated over the last century. In just over 100 years, the world lost as much forest as it had in the previous 9,000 years. An area the size of the United States. The chart shows that this was driven by the continued expansion of land for agriculture. By 1950, there was almost as much agricultural land as forest – 43% of habitable land. By 2018, this had increased to 46%, while forests shrank to 38%. When we think of the growing pressures on land from modern populations, we often picture sprawling megacities. But urban land accounts for just 1% of global habitable land. Humanity’s most extensive footprint is due to what we eat, not where we live.
How can we put an end to our long history of deforestation?
This might paint a bleak picture for the future of the world’s forests: the United Nations projects that the global population will continue to grow, reaching 10.8 billion by 2100. But there are real reasons to believe this century doesn’t have to replicate the destruction of the last one.
The world passed ‘peaked deforestation’ in the 1980s and has been on the decline since then – we look at forest loss rates since 1700 in our follow-up post. Improvements in crop yields mean the per capita demand for agricultural land continues to fall. We see this in the chart. Since 1961, the amount of land we use for agriculture has increased by only 7%. Meanwhile, the global population increased by 147% – from 3.1 to 7.6 billion.8 This means that agricultural land per person is more than halved, from 1.45 to 0.63 hectares.
The world may have already passed ‘peak agricultural land’ [we will look at this in more detail in an upcoming post]. And with the growth of technological innovations such as lab-grown meat and substitute products, there is the real possibility that we can continue to enjoy meat or meat-like foods while freeing up the massive amounts of land we use to raise livestock.
If we can take advantage of these innovations, we can bring deforestation to an end. A future with more people and more forests is possible.
Global deforestation peaked in the 1980s. Can we bring it to an end?
Since the end of the last great ice age – 10,000 years ago – the world has lost one-third of its forests.9 Two billion hectares of forest – an area twice the size of the United States – have been cleared to grow crops, raise livestock, and use for fuelwood.
In a previous post, we looked at this change in global forests over the long run. This showed that although humans have been deforesting the planet for millennia, the rate of forest loss has accelerated rapidly in the last few centuries. Half of the global forest loss occurred between 8,000 BC and 1900; the other half was lost in the last century alone.
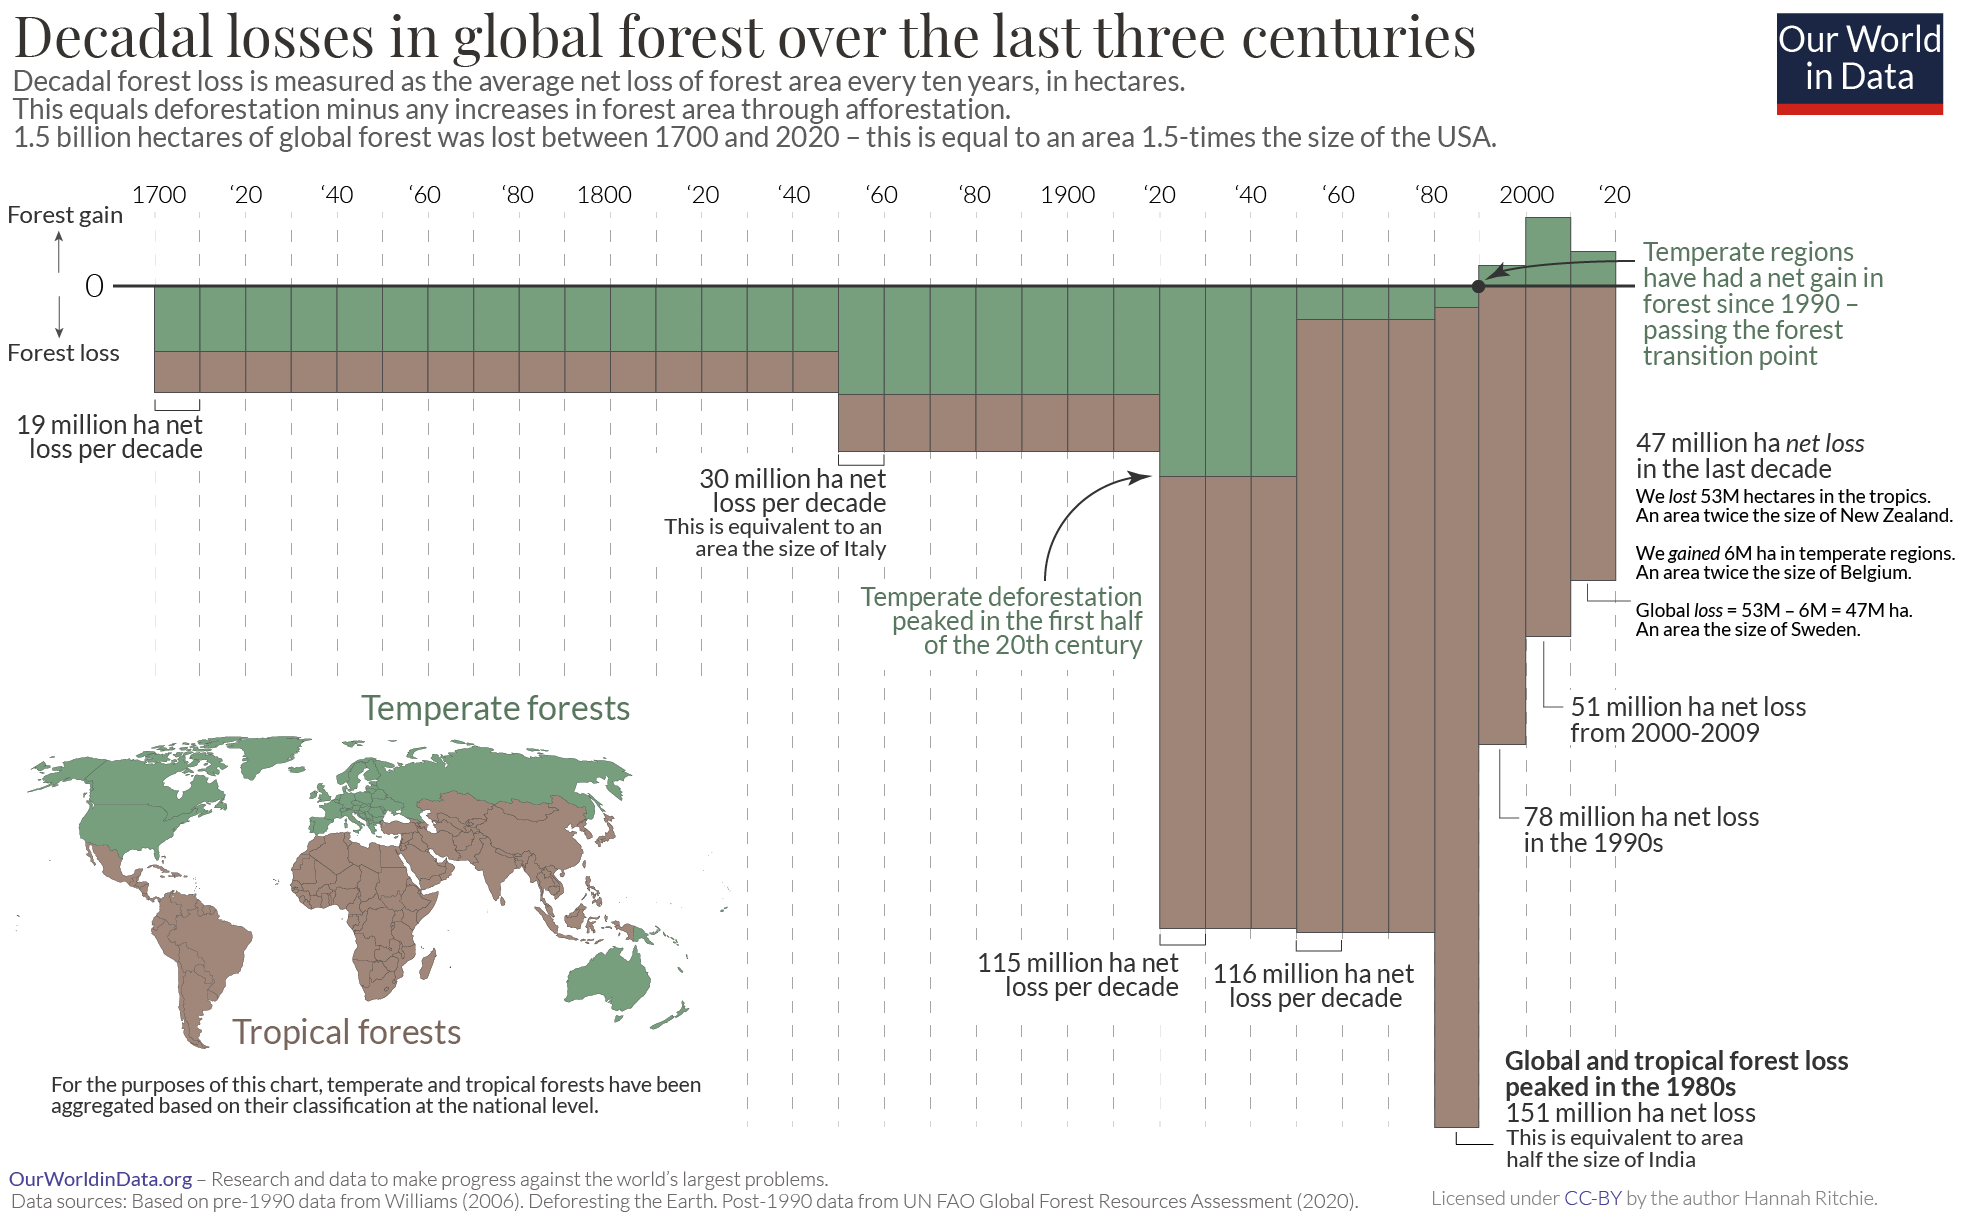
To understand this more recent forest loss, let’s zoom in on the last 300 years. The world lost 1.5 billion hectares of forest over that period. That’s an area 1.5 times the size of the United States.
The chart shows the decadal losses and gains in global forest cover. On the horizontal axis, we have time, spanning from 1700 to 2020; on the vertical axis, we have the decadal change in forest cover. The taller the bar, the more significant the difference in the forest area. This is measured in hectares, which is equivalent to 10,000 m².
Forest loss measures the net change in forest cover: the loss in forests due to deforestation plus any forest expansion through afforestation.10
I have brought together data from several sources to reconstruct this change.11 We’ve also differentiated between temperate forests (the sum of ‘boreal’ and ‘temperate’ areas), shown in green, and tropical forests (the sum of ‘tropical’ and ‘subtropical’ areas), established in brown. It’s helpful to make this distinction because – as we will see – where the world has lost forests has shifted.
The rate of forest loss changed a lot. From 1700 to 1850, 19 million hectares were being cleared every decade. That’s around half the size of Germany. From 1850 to 1920, losses were around 50% higher at 30 million hectares per decade –like losing a forested area the size of Italy every ten years. It was predominantly temperate forests that were being lost at this time. Population growth meant that today’s rich countries across Europe and North America needed more and more resources, such as land for agriculture, wood for energy, and for construction.12
Moving into the 20th century, there was a stepwise change in demand for agricultural land and energy from wood. Deforestation rates accelerated. From the 1920s through to the 1980s, decadal losses quadrupled to almost 120 million hectares. That’s equivalent to the area of South Africa. This increase was driven mainly by tropical deforestation as countries across Asia and Latin America followed the path of Europe and North America.
Global deforestation reached its peak in the 1980s. During that decade, we lost 150 million hectares – an area half the size of India. Clearing the Brazilian Amazon for pasture and croplands was a significant driver of this loss.
Since then, deforestation rates have steadily declined, to 78 million hectares in the 1990s, 52 million in the early 2000s, and 47 million in the last decade.
As we explore in more detail in our related article, countries tend to follow a predictable development in forest cover, a U-shaped curve.13 They lose forests as populations grow and demand for agricultural land and fuel increases, but eventually, they reach the so-called ‘forest transition point’ where they begin to regrow more forests than they lose.
Within this global aggregated trend, many forest transitions are occurring at local, national, or regional levels. We see one such change in the chart: the forest loss in the temperate regions – shown as the green part of the bars – peaked much earlier than the global forest loss. In the first half of the 20th century, temperate forests reached their peak loss at 34 million hectares per decade, and by 1990 they had passed the ‘forest transition point’. For the past 30 years, temperate regions have seen a continued increase in forest cover through afforestation: you see this as the bars are now ‘positive’ (pointing upwards). Across temperate forests, the world gained 6 million hectares in the last decade.
Tropical forests, on aggregate, have also passed peak deforestation in the 1980s – the longest of all bars – but have not passed the transition to reforestation. Some countries within this group are still far behind peak deforestation. Without a concerted effort to protect these forests, it could be decades before forests in those countries approach the transition point [as we show in a related post].14
The history of deforestation is tragic; we have lost not only these wild and beautiful landscapes but also the wildlife within them. But, the fact that forest transitions are possible should give us confidence that a positive future is possible. Many countries have not only ended deforestation but achieved substantial reforestation. It will be possible for our generation to achieve the same on a global scale and bring the 10,000-year history of forest loss to an end.
To end deforestation, we need to understand where and why it’s happening, where countries are in their transition, and what can be done to accelerate their progress. We must pass the transition point as soon as possible while minimizing the amount of forest we lose along the way.