
Empirical View
IN THIS SECTION
- Decreasing Number of Oil Spills
- Decreasing Quantities of Oil Spilled
- Oil spills unrelated to tankers
Decreasing Number of Oil Spills
Number of medium-sized (7-700 tonnes) and large spills (> 700 tonnes) caused by tankers, 1970-2016
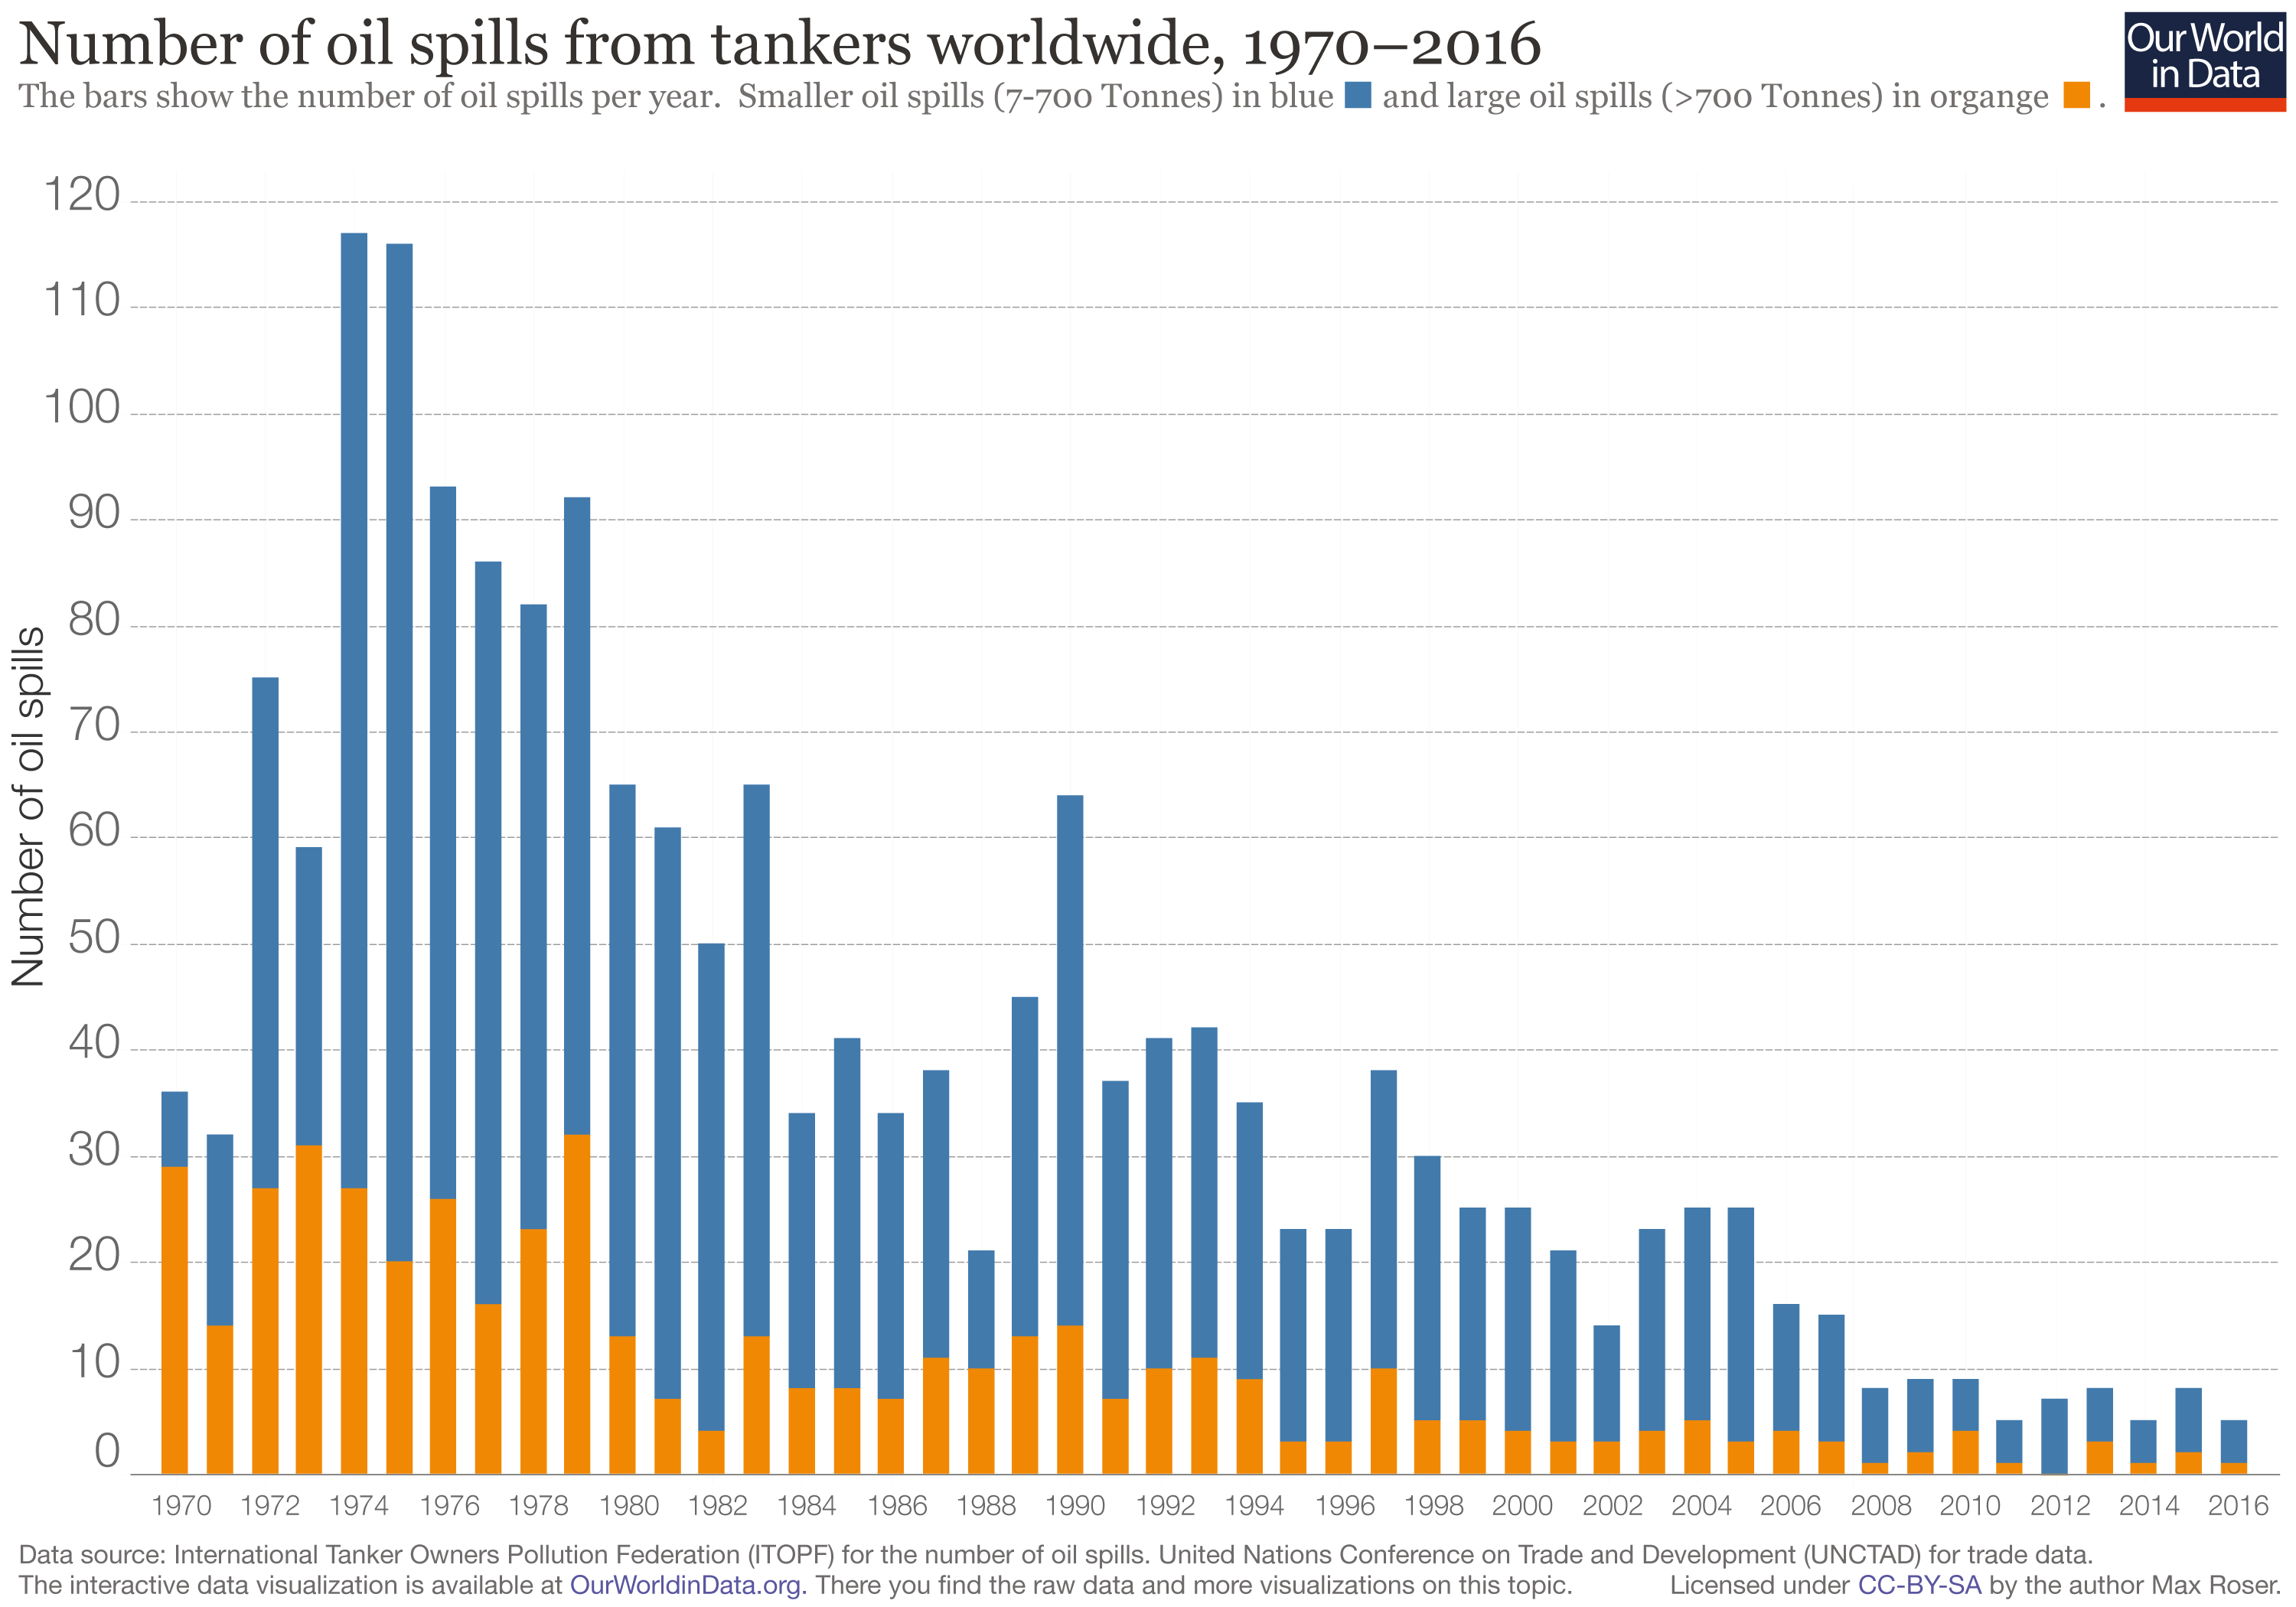
Over the past four and half decades – the time for which we have data – oil spills from tankers decreased very substantially.
The dataset by the International Tanker Owners Pollution Federation (ITOPF) covers more than four decades over which time the incidence of large oil spills from tankers greatly decreased.
While in the 1970s there were 24.5 large (> 700 tonnes) oil spills per year, in the 2010s the average number of large oil spills decreased to 1.7 oil spills per year.
Both, large oil spills and medium-sized oil spills (7-700 tonnes) are decreasing. This happened as the worldwide trade of petroleum and gas products increased. Included in the trade statistics is the trade of LNG, LPG, naphtha, gasoline, jet fuel, kerosene, light oil, heavy fuel oil and others, according to the source (UNCTAD).
Decreasing Quantities of Oil Spilled
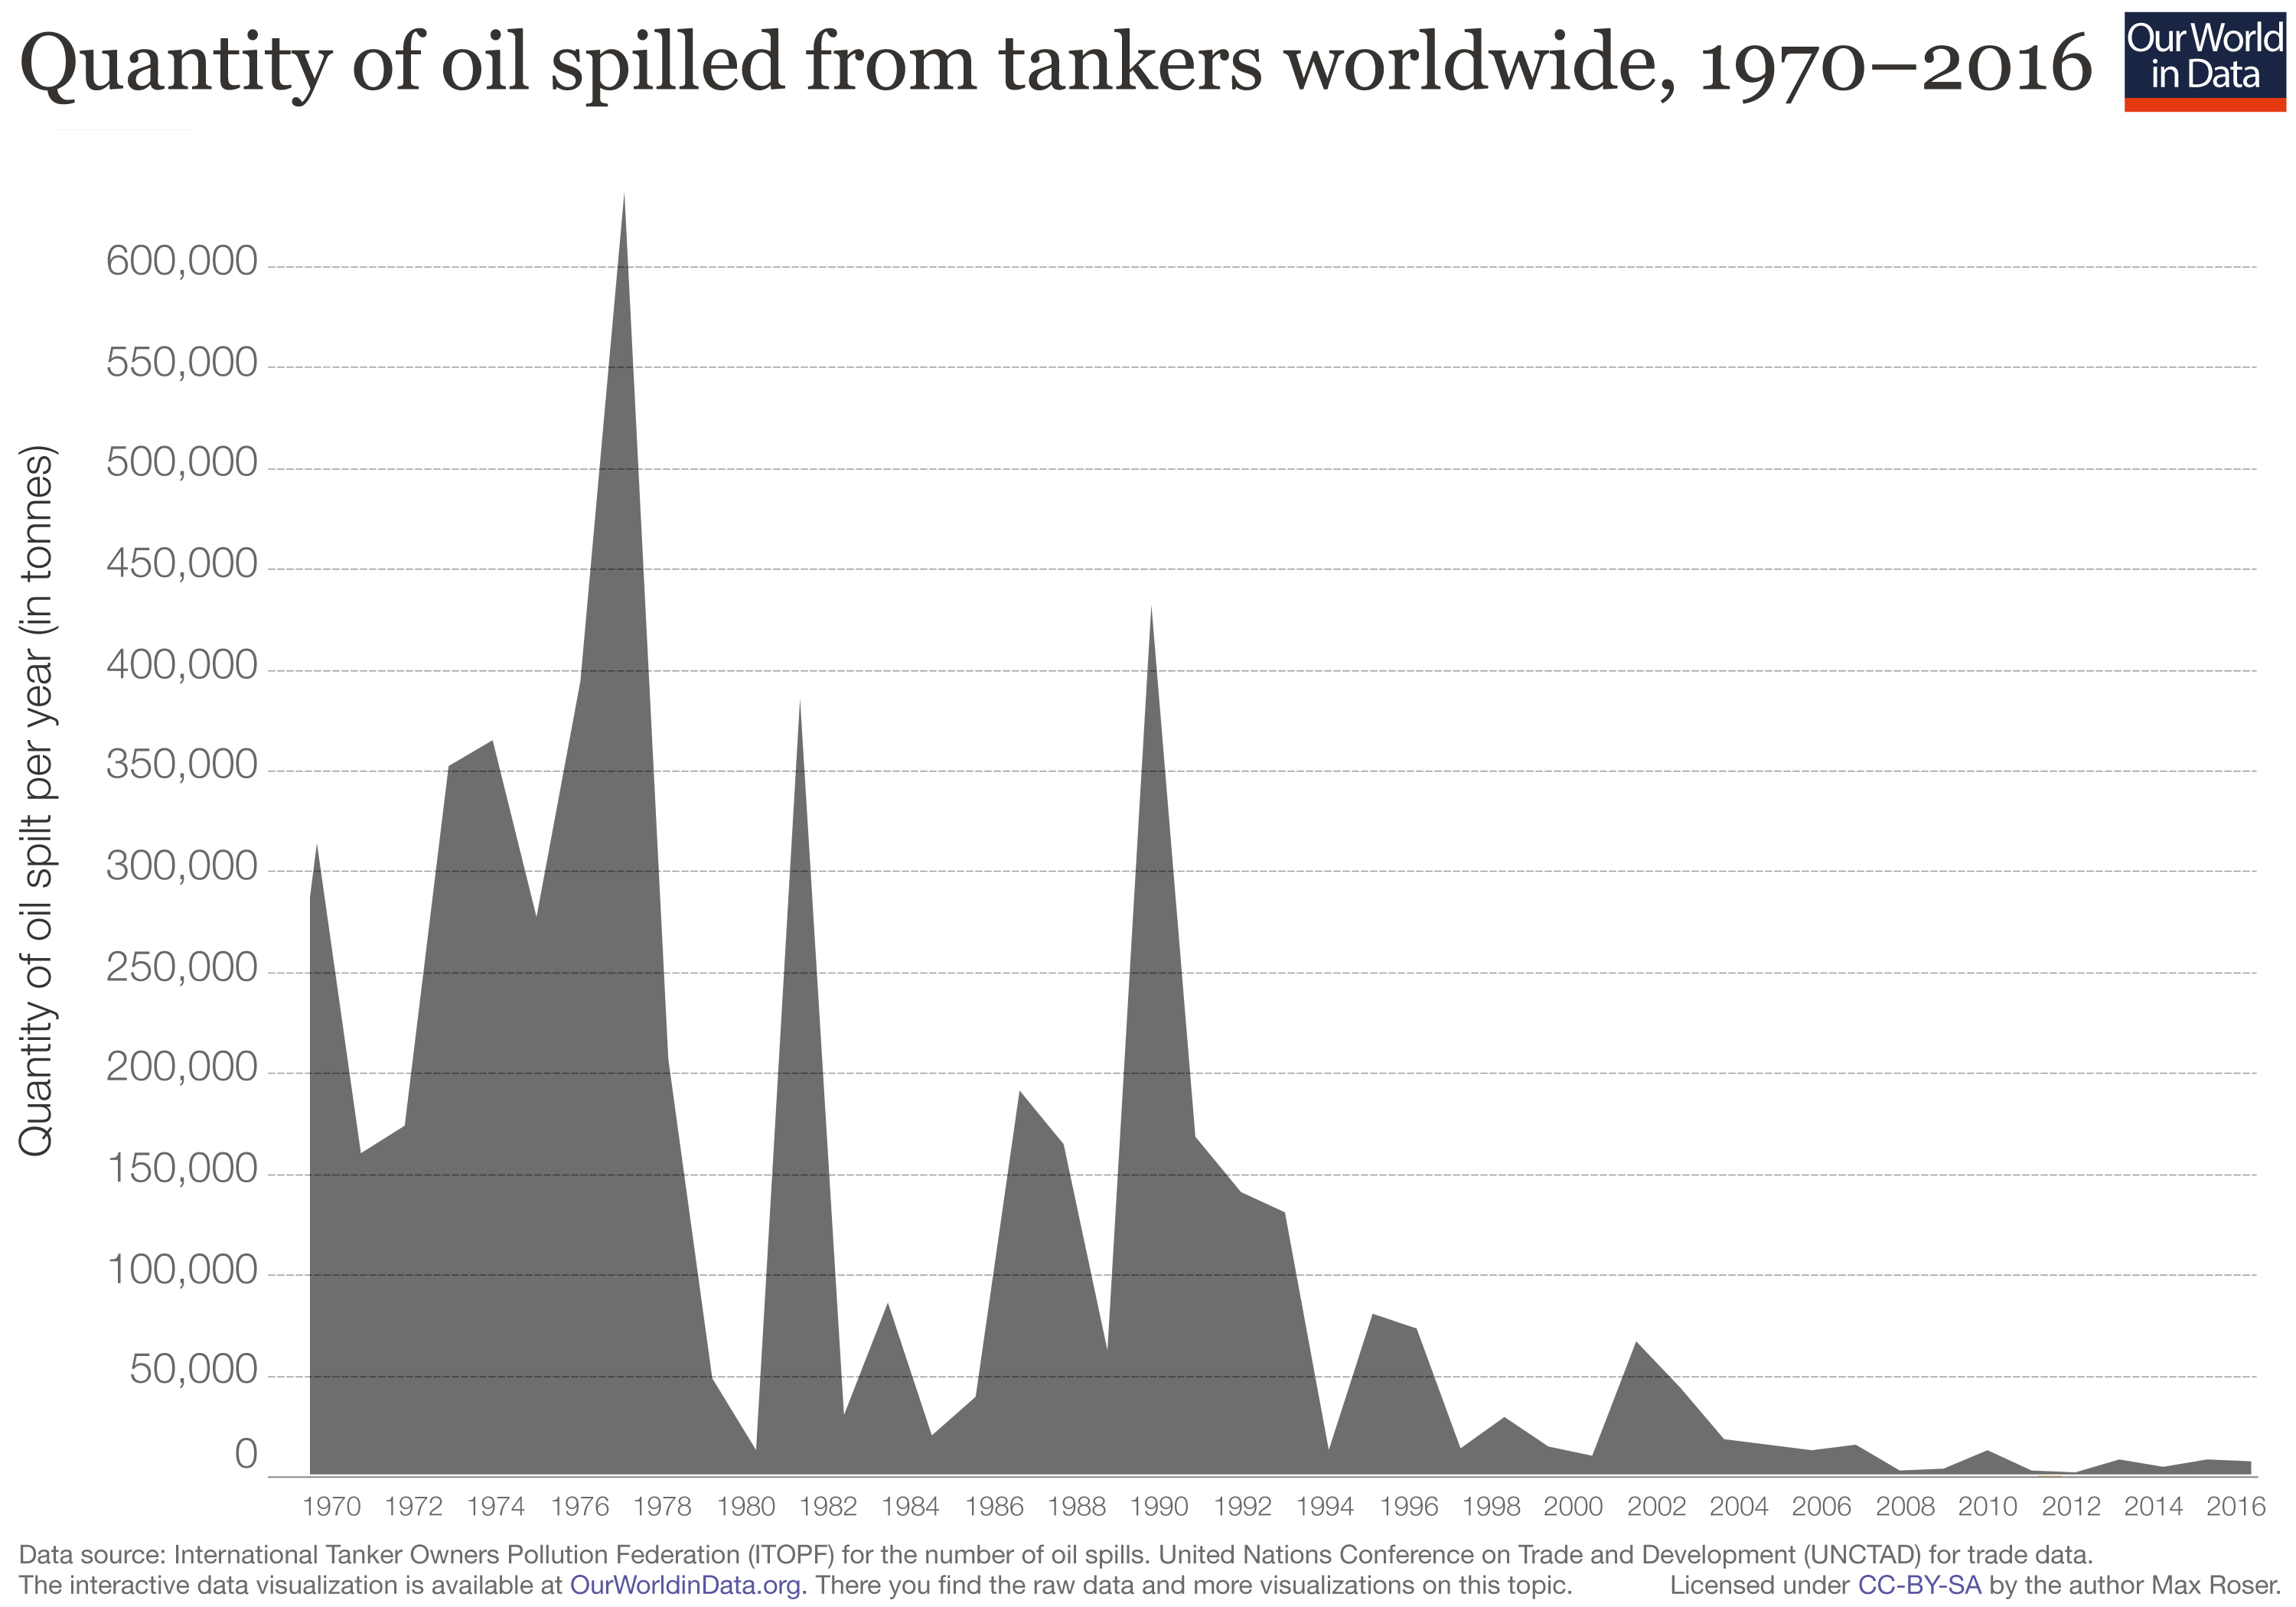
ITOPF estimated that between 1970 and 2016 approximately 5.73 million tonnes of oil were lost as a result of tanker incidents. As single large incidents can be responsible for a huge share of all the oil spilled in a given year, it is advisable to look at trends or decade averages. Over these 43 years, the annual quantity of oil spilled decreased hugely. In the 21st century, the quantity of spilled oil was smaller than in several single years in earlier decades. 2012 saw the lowest oil spillage on record so far: 1000 tonnes were spilled. The development can be seen in the following visualization.
Since reports on small (<7 tonnes) oil spills are less reliable only medium-sized and large oil spills are included in these estimates. These are the oil spills presented in the chart before.
The change of seaborne oil trade can be inferred from the following figure. Since the mid-1980s, seaborne oil trade has been increasing while the number of oil spills is decreasing. This makes clear that the decrease in oil spills is not due to a decrease in oil trade. On the contrary, the share of oil that is not reaching its destination is falling very strongly and is small today.
Oil spills unrelated to tankers
According to the ITOPF dataset, the largest oil spill caused by a tanker was caused by the SS Atlantic Empress, which sank close to Trinidad and Tobago in 1979.
Wikipedia lists five oil spills that were not caused by tankers that were larger than this:
- The biggest oil spill in history was the Lakeview Gusher (1910-11 in California),
- the second biggest was the Gulf War oil spill (1991),
- the 3rd biggest was the Deepwater Horizon (2010),
- 4th was Ixtoc I oil spill in Mexico (1979-1980)
- and 5th was a long-lasting spill in the Niger Delta between 1976 and 1996.
Data Sources
The International Tanker Owners Pollution Federation (ITOPF) maintains a database on oil spills caused by tankers, combined carriers and barges since 1970. The data covers the entire planet. The database can be found here. For all of these the ITOPF data base records, the type of oil spilled, the spill amount, the cause and location of the incident and the vessel involved. The size of a spillage is grouped into three categories: less than 7 tonnes, 7-700 tonnes, and more than 700 tonnes of oil spilled. The majority of incidents belong to the smallest category of spillages. Nowadays oil spills can be detected by computer systems on the basis of satellite images. For the past, data is taken from other sources: Data on smaller spills are taken from the vessel owners and their insurers. For the larger spills, the majority of information is taken from published sources of the shipping press.