
Summary
- Extinctions have been a natural part of our planet’s evolutionary history. More than 99% of the four billion species that have evolved on Earth are now gone.
- At least 900 species have gone extinct in the last five centuries.
- Only a small percentage of species have been evaluated for their extinction risk. This means estimates of species threatened with extinction will be an underestimate of the true number.
- More than 35,000 species have been evaluated to be threatened with extinction today.
- One-quarter of the world’s mammals; 1-in-6 bird species; and 40% of amphibians are threatened.
- There have been five mass extinction events in Earth’s history: ‘The Big Five’.
- More than 178 of the world’s largest species went extinct during the Quaternary Extinction. Overhunting was likely the main driver.
- Extinction rates today are much higher than background rates and rates from previous mass extinctions.
- While many species are in danger, conservation has also saved tens of mammal and bird species from extinction.
How many species have gone extinct?
Extinctions have been a natural part of the planet’s evolutionary history. 99% of the four billion species that have evolved on Earth are now gone.1 Most species have gone extinct.
But when people ask the question of how many species have gone extinct, they’re usually talking about the number of extinctions in recent history. Species that have gone extinct, mainly due to human pressures.
The IUCN Red List has estimated the number of extinctions over the last five centuries. Unfortunately, we don’t know about everything about all of the world’s species over this period, so it’s likely that some will have gone extinct without us even knowing they existed in the first place. So this is likely to be an underestimate.
In the chart, we see these estimates for different taxonomic groups. It estimates that 900 species have gone extinct since 1500. Our estimates for the better-studied taxonomic groups are likely to be more accurate. This includes 85 mammals; 159 birds; 35 amphibians; and 80 fish species.
Species threatened with extinction today
IN THIS SECTION
- How many species are threatened with extinction?
- What percentage of species are threatened with extinction?
To understand the biodiversity problem we need to know how many species are under pressure; where they are; and what the threats are. To do this, the IUCN Red List of Threatened Species evaluates species across the world for their level of extinction risk. It does this evaluation every year and continues to expand its coverage.
The IUCN has not evaluated all of the world’s known species; in fact, in many taxonomic groups, it has assessed only a very small percentage. In 2020, it had assessed only 6% of described species. But, this very much varies by taxonomic group. In the chart, we see the share of described species in each group that has been assessed for their level of extinction risk. As we’d expect, animals such as birds, mammals, amphibians have seen a much larger share of their species assessed – more than 80%. Only 1% of insects have. And less than 1% of the world’s fungi.
The lack of complete coverage of the world’s species highlights two important points we need to remember when interpreting the IUCN Red List data:
- Changes in the number of threatened species over time do not necessarily reflect increasing extinction risks. The IUCN is a project that continues to expand. More and more species are been evaluated every year. In the year 2000, less than 20,000 species had been evaluated. By 2020, 130,000 had. As more species are evaluated, inevitably, more will be listed as being threatened with extinction. This means that tracking the data on the number of species at risk of extinction over time doesn’t necessarily reflect an acceleration of extinction threats; a lot is simply explained by an acceleration of the number of species being evaluated. This is why we do not show trends for the number of threatened species over time.
- The number of threatened species is an underestimate. Since only 6% of described species have been evaluated (for some groups, this is much less) the estimated number of threatened species is likely to be much lower than the actual number. There are inevitably more threatened species within the 94% that have not been evaluated.
We should also define more clearly what threatened with extinction actually means. The IUCN Red List categorizes species based on their estimated probability of going extinct within a given period of time. These estimates take into account population size, the rate of change in population size, geographical distribution, and the extent of environmental pressures on them. ‘Threatened’ species is the sum of the following three categories:
- Critically endangered species have a probability of extinction higher than 50% in ten years or three generations;
- Endangered species have a greater than 20% probability in 20 years or five generations;
- Vulnerable has a probability greater than 10% over a century.
How many species are threatened with extinction?
The IUCN Red List has evaluated 35,765 species across all taxonomic groups to be threatened with extinction in 2020. As we noted earlier, this is a large underestimate of the true number because most species have not been evaluated.
In the chart, we see the number of species at risk in each taxonomic group. Since birds, mammals, and amphibians are the most well-studied groups their numbers are the most accurate reflection of the true number. The numbers for understudied groups such as insects, plants and fungi will be a large underestimate.
What percentage of species are threatened with extinction?
What share of known species are threatened with extinction? Since the number of species that have been evaluated for their extinction risk is such a small fraction of the total known species, it makes little sense for us to calculate this figure for all species, or for groups that are significantly understudied. It will tell us very little about the actual share of species that are threatened.
But we can calculate it for the well-studied groups. The IUCN Red List provides this figure for groups where at least 80% of described species have been evaluated. These are shown in the chart.
Around one-quarter of the world’s mammals; 1-in-6 bird species; and 40% of amphibians are at risk. In more niche taxonomic groups – such as horseshoe crabs and gymnosperms, most species are threatened.
The ‘Big Five’ Mass Extinctions
Many people say we’re in the midst of the sixth mass extinction. That human pressures on wildlife – deforestation, poaching, overfishing and climate change – are pushing many of the world’s species to the brink. Before we look at whether there is any truth to this, we should take a look at history’s mass extinction events. When and why did they happen?
What is a mass extinction?
First, we need to be clear on what we mean by ‘mass extinction’. Extinctions are a normal part of evolution: they occur naturally and periodically over time.2 There’s a natural background rate to the timing and frequency of extinctions: 10% of species are lost every million years; 30% every 10 million years; and 65% every 100 million years.3 It would be wrong to assume that species going extinct is out of line with what we would expect. Evolution occurs through the balance of extinction – the end of species – and speciation – the creation of new ones.
Extinctions occur periodically at what we would call the ‘background rate’. We can therefore identify periods of history when extinctions were happening much faster than this background rate – this would tell us that there was an additional environmental or ecological pressure creating more extinctions than we would expect.
But mass extinctions are defined as periods with much higher extinction rates than normal. They are defined by both magnitude and rate. Magnitude is the percentage of species that are lost. Rate is how quickly this happens. These metrics are inevitably linked, but we need both to qualify as a mass extinction.
In a mass extinction at least 75% of species go extinct within a relatively (by geological standard) short period of time.4 Typically less than two million years.
The ‘Big Five’ mass extinctions
There have been five mass extinction events in Earth’s history. At least, since 500 million years ago; we know very little about extinction events in the Precambrian and early Cambrian earlier which predates this. These are called the ‘Big Five’, for obvious reasons.
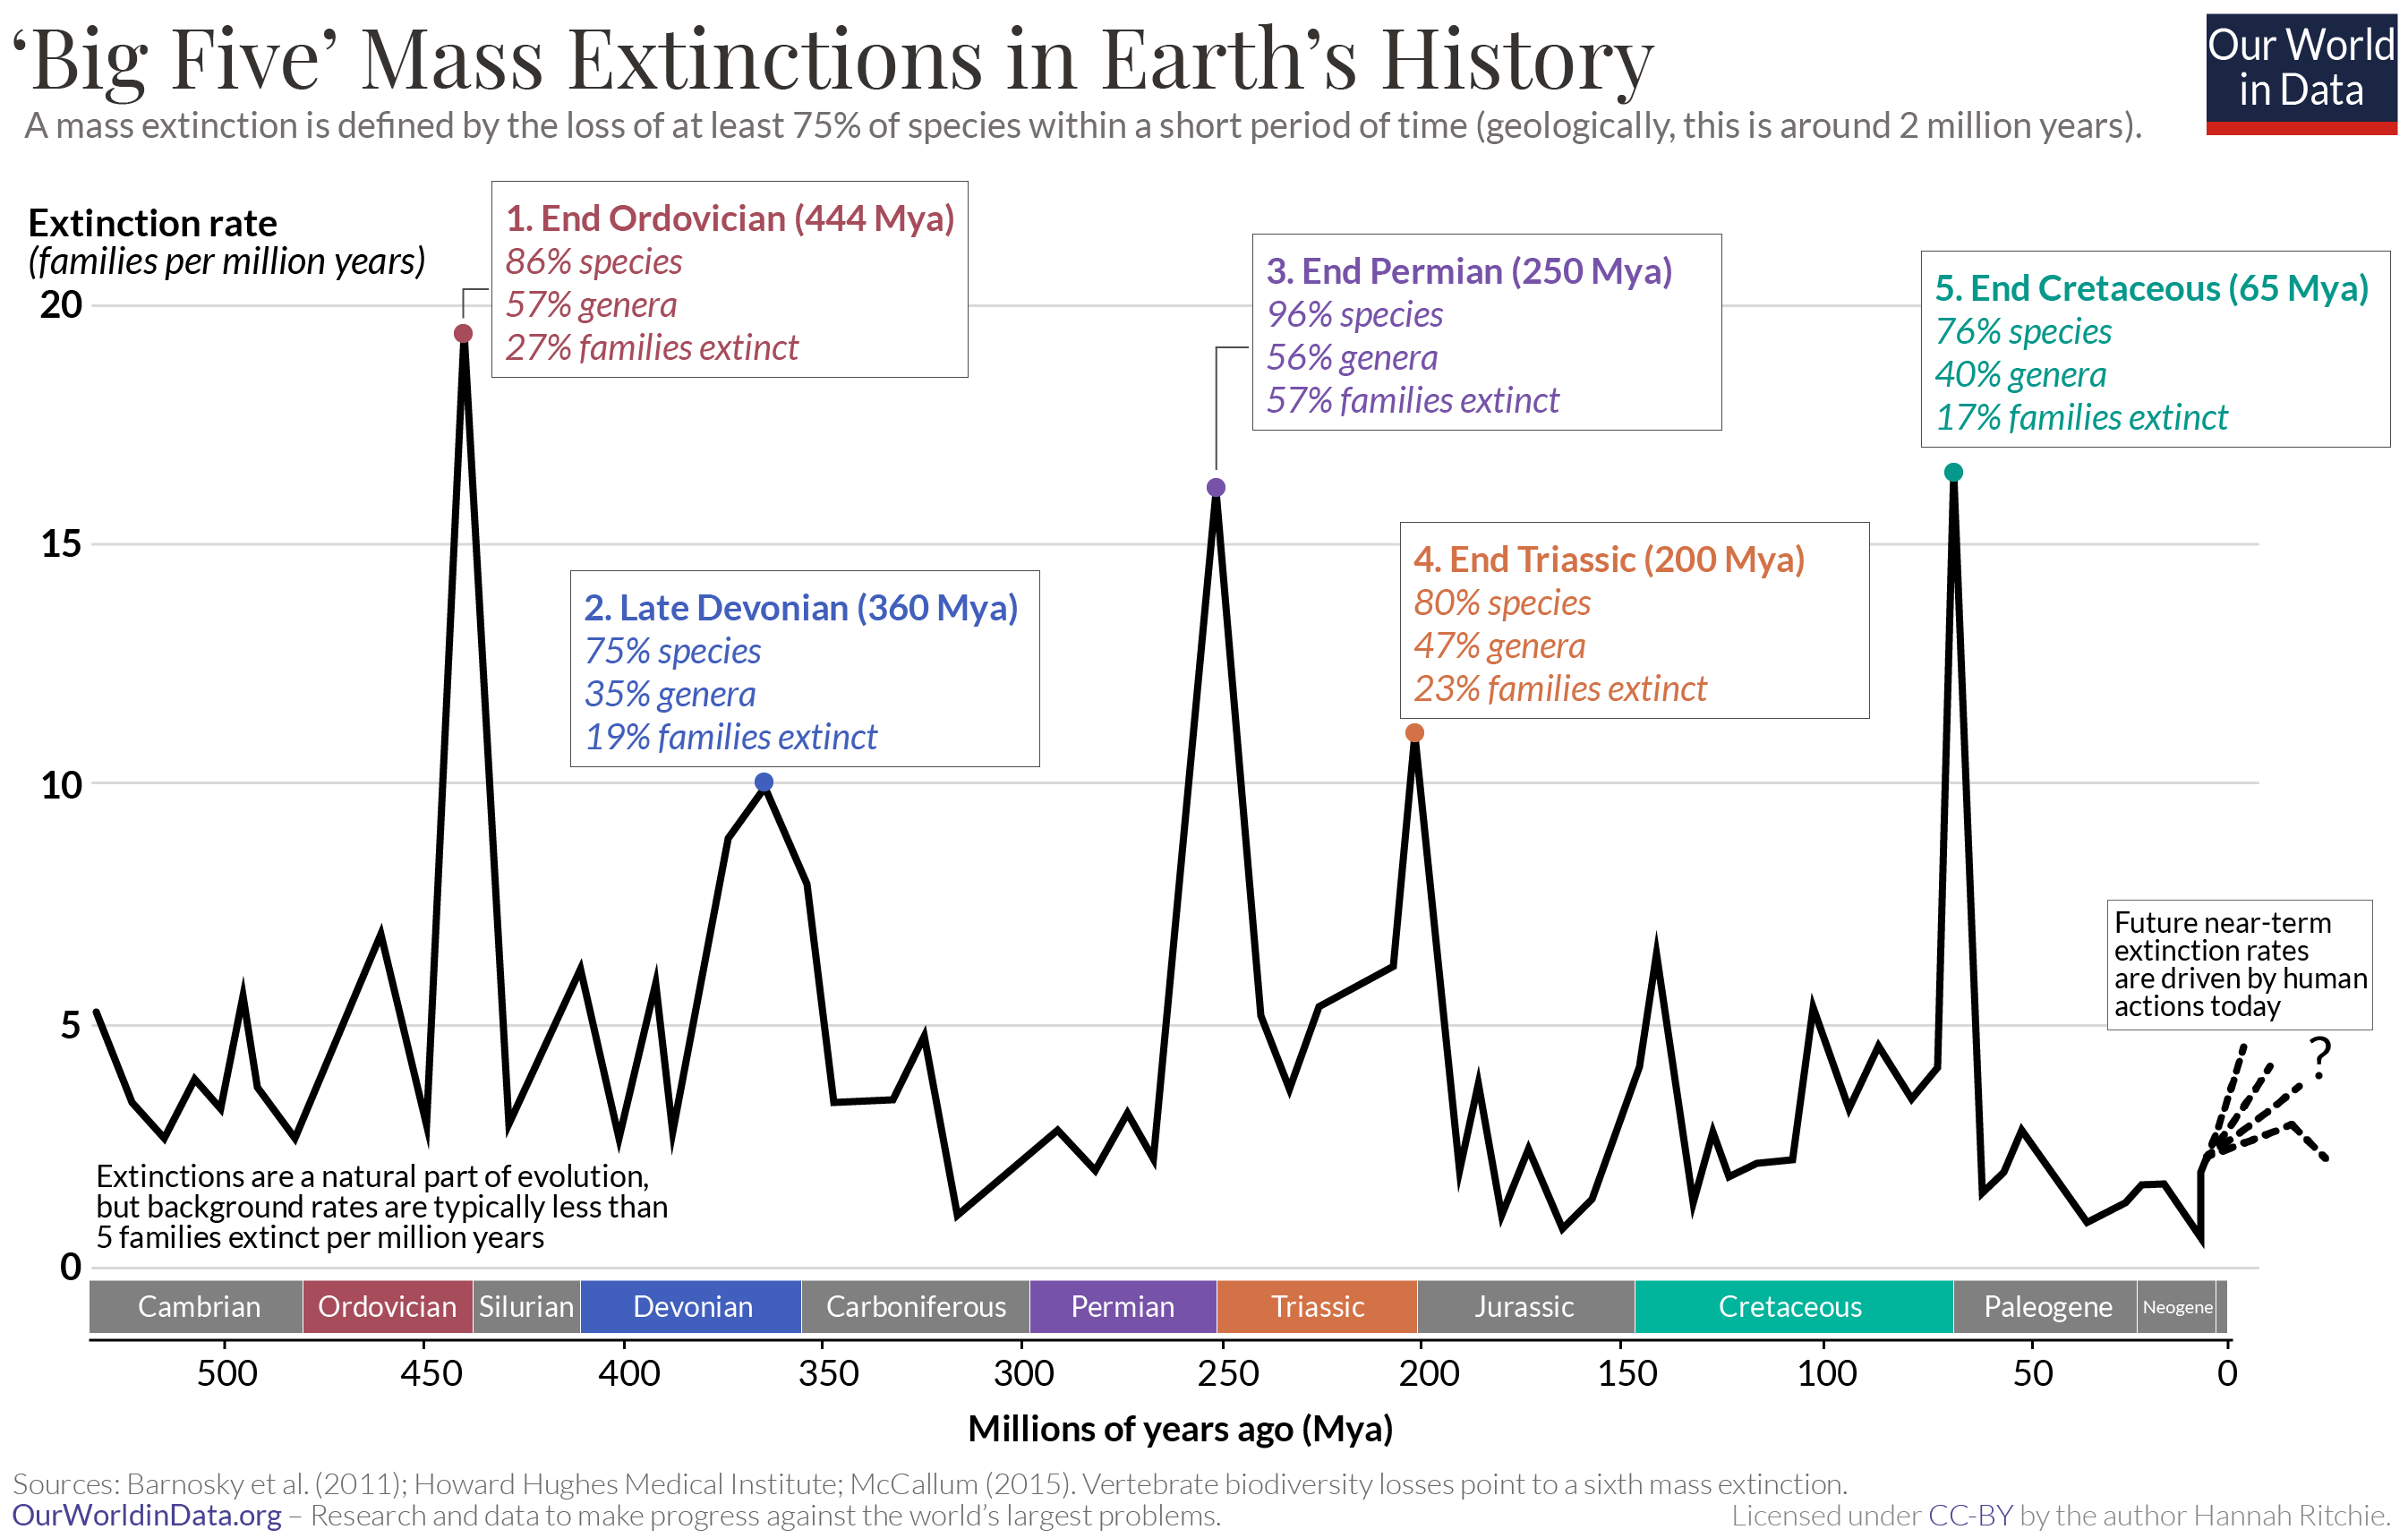
In the chart, we see the timing of events in Earth’s history. It shows the changing extinction rate (measured as the number of families that went extinct per million years). Again, note that this number was never zero: background rates of extinction were low – typically less than 5 families per million years – but ever-present through time.
We see the spikes in extinction rates marked as the five events:
- End Ordovician (444 million years ago; mya)
- Late Devonian (360 mya)
- End Permian (250 mya)
- End Triassic (200 mya) – many people mistake this as the event that killed off the dinosaurs. But in fact, they were killed off at the end of the Cretaceous period – the fifth of the ‘Big Five’.
- End Cretaceous (65 mya) – the event that killed off the dinosaurs.
Finally, at the end of the timeline, we have the question of what is to come. Perhaps we are headed for the sixth mass extinction. But we are currently far from that point. There is a range of trajectories that the extinction rate could take in the decades and centuries to follow; which one we follow is determined by us.
What caused the ‘Big Five’ mass extinctions?
All of the ‘Big Five’ was caused by some combination of rapid and dramatic changes in climate, combined with significant changes in the composition of environments on land or in the ocean (such as ocean acidification or acid rain from intense volcanic activity).
| Extinction Event | Age(mya) | Percentage of species lost | Cause of extinctions |
| End Ordovician | 444 | 86% | Intense glacial and interglacial periods created large swings in sea levels and moved shorelines dramatically. Tectonic uplift of the Appalachian mountains created lots of weathering, sequestration of CO2 and with it, changes in climate and ocean chemistry. |
| Late Devonian | 360 | 75% | Rapid growth and diversification of land plants generated rapid and severe global cooling. |
| End Permian | 250 | 96% | Intense volcanic activity in Siberia. This caused global warming. Elevated CO2 and sulphur (H2S) levels from volcanoes caused ocean acidification, acid rain, and other changes in ocean and land chemistry. |
| End Triassic | 200 | 80% | Underwater volcanic activity in the Central Atlantic Magmatic Province (CAMP) caused global warming, and a dramatic change in chemistry composition in the oceans. |
| End Cretaceous | 65 | 76% | Asteroid impact in Yucatán, Mexico. This caused global cataclysm and rapid cooling. Some changes may have already pre-dated this asteroid, with intense volcanic activity and tectonic uplift. |
In the table here I detail the proposed causes for each of the five extinction events.7
Quaternary Megafauna Extinctions
IN THIS SECTION
- Did humans cause the Quaternary Megafauna Extinction?
Humans have had such a profound impact on the planet’s ecosystems and climate that Earth might be defined by a new geological epoch: the Anthropocene (where “anthro” means “human”). Some think this new epoch should start at the Industrial Revolution, some at the advent of agriculture 10,000 to 15,000 years ago. This feeds into the popular notion that environmental destruction is a recent phenomenon.
The lives of our hunter-gatherer ancestors are instead romanticized. Many think they lived in balance with nature, unlike modern society where we fight against it. But when we look at the evidence of human impacts over millennia, it’s difficult to see how this was true.
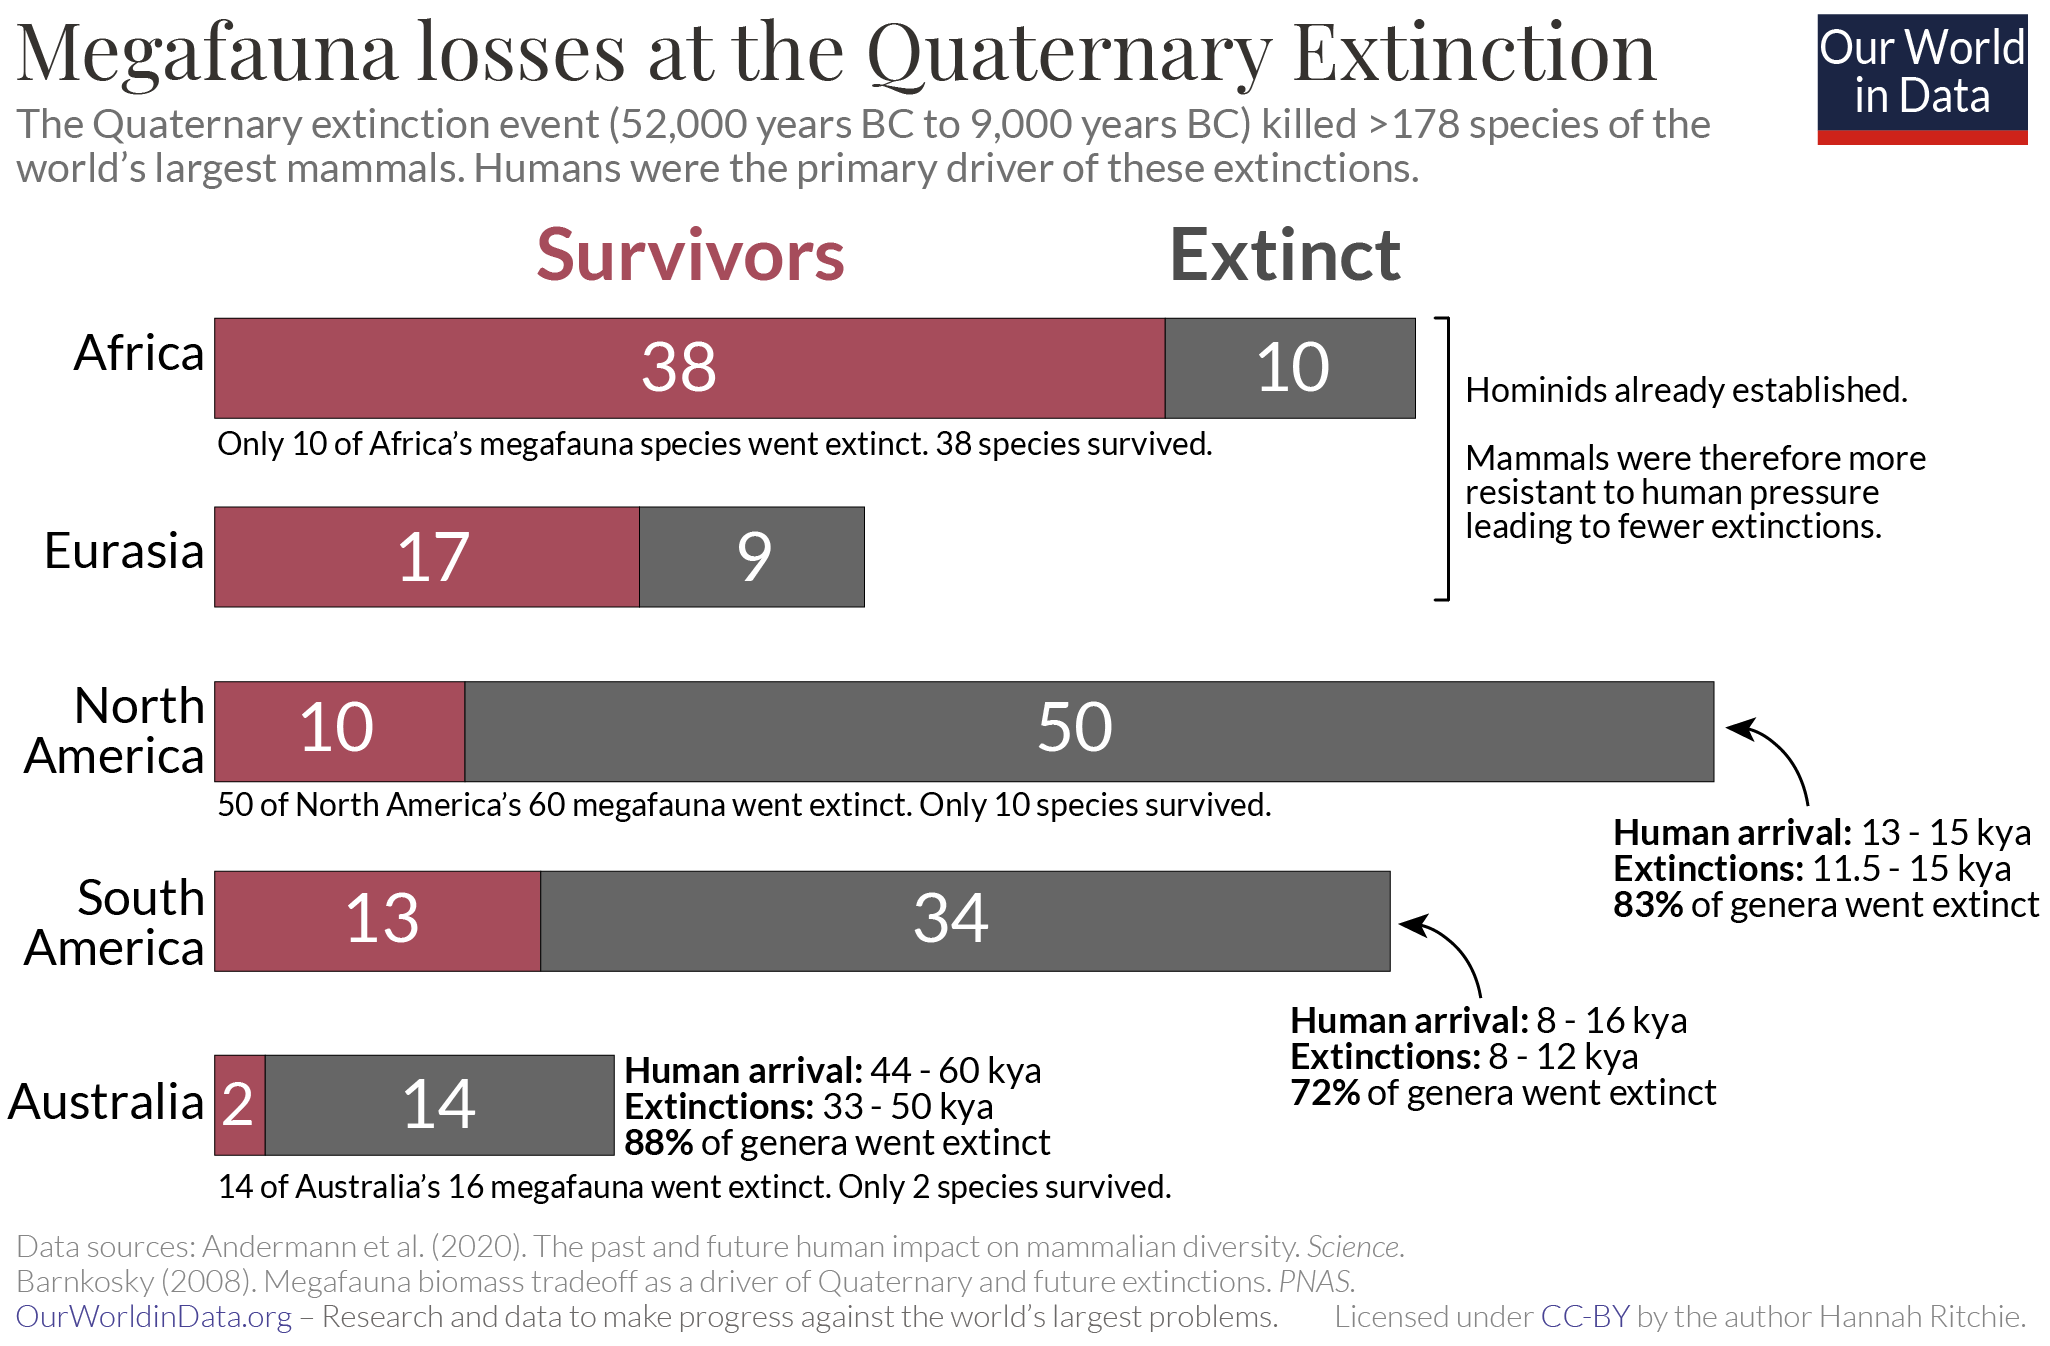
Our ancient ancestors drove more than 178 of the world’s largest mammals (‘megafauna’) to extinction. This is known as the ‘Quaternary Megafauna Extinction’ (QME). The extent of these extinctions across continents is shown in the chart. Between 52,000 and 9,000 BC, more than 178 species of the world’s largest mammals (those heavier than 44 kilograms – ranging from mammals the size of sheep to elephants) were killed off. There is strong evidence to suggest that these were primarily driven by humans – we look at this in more detail later.
Africa was the least hard-hit, losing only 21% of its megafauna. Humans evolved in Africa, and hominins had already been interacting with mammals for a long time. The same is also likely to be true across Eurasia, where 35% of megafauna were lost. But Australia, North America and South America were particularly hard-hit; very soon after humans arrived, most large mammals were gone. Australia lost 88%; North America lost 83%; and South America, 72%.
Far from being in balance with ecosystems, very small populations of hunter-gatherers changed them forever. By 8,000 BC – almost at the end of the QME – there were only around 5 million people in the world. A few million killed off hundreds of species that we will never get back.
Did humans cause the Quaternary Megafauna Extinction?
The driver of the QME has been debated for centuries. The debate has been centred around how much was caused by humans and how much by changes in climate. Today the consensus is that most of these extinctions were caused by humans.
There are several reasons why we think our ancestors were responsible.
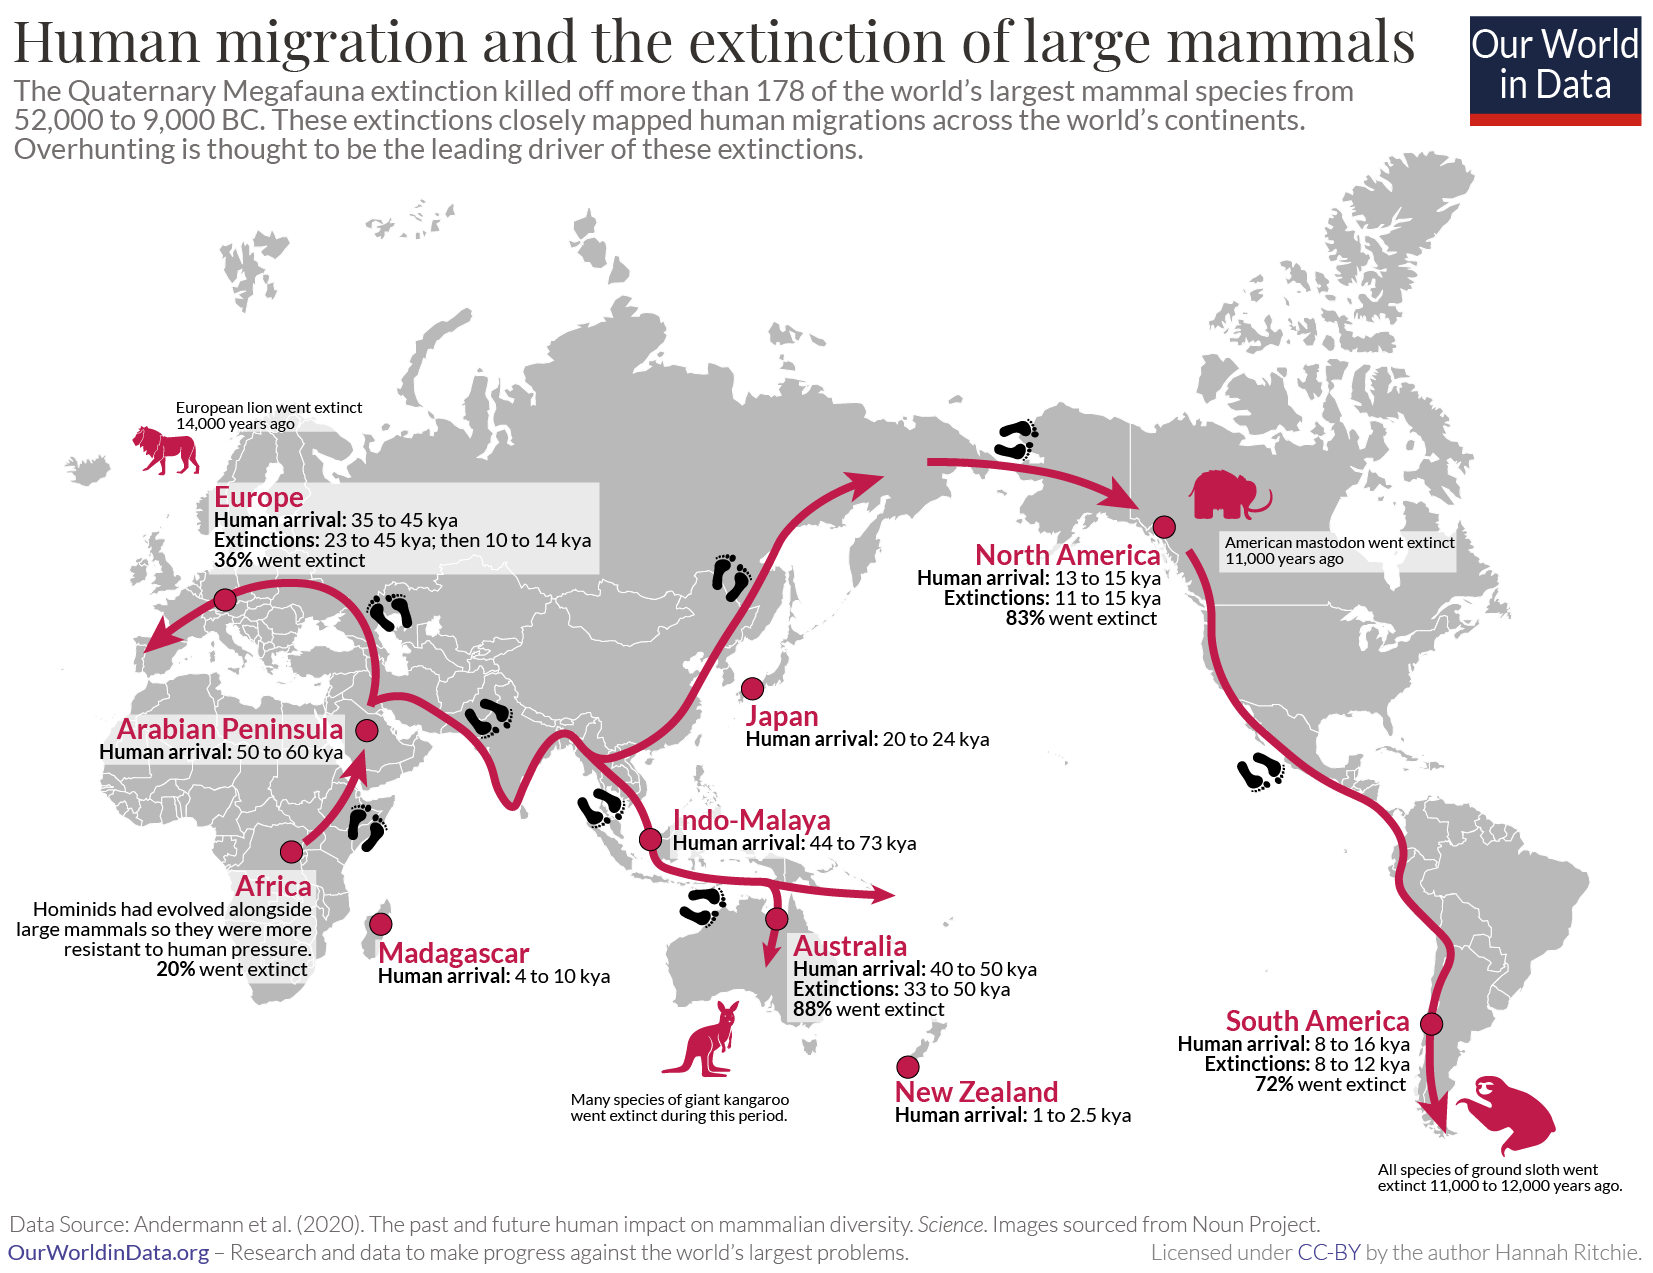
Extinction timings closely match the timing of human arrival. The timing of megafauna extinctions was not consistent across the world; instead, the timing of their demise coincided closely with the arrival of humans on each continent. The timing of human arrivals and extinction events is shown on the map.
Humans reached Australia somewhere between 65 to 44,000 years ago.8 Between 50 and 40,000 years ago, 82% of megafauna had been wiped out. It was tens of thousands of years before the extinction in North and South America occurred. And several more before these occurred in Madagascar and the Caribbean islands. Elephant birds in Madagascar were still present eight millennia after the mammoth and mastodon were killed off in America. Extinction events followed man’s footsteps.
Significant climatic changes tend to be felt globally. If these extinctions were solely due to climate we would expect them to occur at a similar time across the continents.
QME selectively impacted large mammals. There have been many extinction events in Earth’s history. There have been five big mass extinction events and a number of smaller ones. These events don’t usually target specific groups of animals. Large ecological changes tend to impact everything from large to small mammals, reptiles, birds, and fish. During times of high climate variability over the past 66 million years (the ‘Cenozoic period’), neither small nor large mammals were more vulnerable to extinction.9
The QME was different and unique in the fossil record: it selectively killed off large mammals. This suggests a strong influence from humans since we selectively hunt larger ones. There are several reasons why large mammals in particular have been at greater risk since the arrival of humans.
Islands were more heavily impacted than Africa. As we saw previously, Africa was less heavily impacted than other continents during this period. We would expect this since hominids had been interacting with mammals for a long time before this. These interactions between species would have impacted mammal populations more gradually and to a lesser extent. They may have already reached some form of equilibrium. When humans arrived on other continents – such as Australia or the Americas – these interactions were new and represented a step-change in the dynamics of the ecosystem. Humans were efficient new predators.
There have now been many studies focused on the question of whether humans were the key driver of the QME. The consensus is yes. Climatic changes might have exacerbated the pressures on wildlife, but the QME can’t be explained by climate on its own. Our hunter-gatherer ancestors were key to the demise of these megafaunas.
Human impact on ecosystems, therefore, dates back tens of thousands of years, despite the Anthropocene paradigm that is this a recent phenomenon. We’ve not only been in direct competition with other mammals, we’ve also reshaped the landscape beyond recognition. Let’s take a look at this transformation.
Are we heading for a sixth mass extinction?
Seeing wildlife populations shrink is devastating. But the extinction of an entire species is a tragedy on another level. It’s not simply a downward trend; it marks a stepwise change. A complex life form that is lost forever.
But extinctions are nothing new. They are a natural part of the planet’s evolutionary history. 99% of the four billion species that have evolved on Earth are now gone.10 Species go extinct, while new ones are formed. That’s life. There’s a natural background rate to the timing and frequency of extinctions: 10% of species are lost every million years; 30% every 10 million years; and 65% every 100 million years.11
What worries ecologists is that extinctions today are happening much faster than nature would predict. This has happened five times in the past: these are defined as mass extinction events and are aptly named the ‘Big Five’ [we cover them in more detail here]. In each extinction event, the world lost more than 75% of its species in a short period of time (here we mean ‘short’ in its geological sense – less than two million years).
Are we in the midst of another one? Many have warned that we’re heading for a sixth mass extinction, this one driven by humans. Is this really true, or are these claims overblown?
How do we know if we’re heading for a sixth mass extinction?
Before we can even consider this question we need to define what a ‘mass extinction’ is. Most people would define it as wiping out all, or most of, the world’s wildlife. But there’s a technical definition. Extinction is determined by two metrics: magnitude and rate. Magnitude is the percentage of species that have gone extinct. Rate measures how quickly these extinctions happened – the number of extinctions per unit of time. These two metrics are tightly linked, but we need both of them to ‘diagnose’ a mass extinction. If lots of species go extinct over a very long period of time (let’s say, 1 billion years), this is not a mass extinction. The rate is too slow. Similarly, if we lost some species very quickly but in the end, it didn’t amount to a large percentage of species, this also wouldn’t qualify. The magnitude is too low. To be defined as a mass extinction, the planet needs to lose a lot of its species quickly.
In a mass extinction, we need to lose more than 75% of species, in a short period of time: around 2 million years. Some mass extinctions happen more quickly than this.
Of course, this is not to say that “only” losing 60% of the world’s species is no big deal. Or that extinctions are the only measure of biodiversity we care about – large reductions in wildlife populations can cause just as much disruption to ecosystems as the complete loss of some species. We look at these changes in other parts of our work [see our article on the Living Planet Index]. But here we’re going to stick with the official definition of mass extinction to test whether these claims are true.
There are a few things that make this difficult. The first is just how little we know about the world’s species and how they’re changing. Some taxonomic groups – such as mammals, birds and amphibians – we know a lot about. We have described and assessed most of their known species. But we know much less about the plants, insects, fungi and reptiles around us. For this reason, mass extinctions are usually assessed for these groups we know most about. This is mostly vertebrates. What we do know is that levels of extinction risk for the small number of plant and invertebrate species that have been assessed are similar to that of vertebrates.12 This gives us some indication that vertebrates might give us a reasonable proxy for other groups of species.
The second difficulty is understanding modern extinctions in the context of longer timeframes. Mass extinctions can happen over the course of a million years or more. We’re looking at extinction over the course of centuries or even decades. This means we’re going to have to make some assumptions or scenarios of what might or could happen in the future.
There are a few metrics researchers can use to tackle this question.
- Extinctions per million species-years (E/MSY). Using reconstructions in the fossil record, we can calculate how many extinctions typically occur every million years. This is the ‘background extinction rate’. To compare this to current rates we can assess recent extinction rates (the proportion of species that went extinct over the past century or two) and predict what proportion this would be over one million species years.
- Compare current extinction rates to previous mass extinctions. We can compare calculations of the current E/MSY to background extinction rates (as above). But we can also compare these rates to previous mass extinction events.
- Calculate the number of years needed for 75% of species to go extinct based on current rates. If this number is less than a few million years, this would fall into ‘mass extinction’ territory.
Calculate extinction rates for the past 500 years (or 200 years, or 50 years)and ask whether extinction rates during previous periods were as high.
How many species have gone extinct in recent centuries?
An obvious question to ask is how many species have gone extinct already. How close to the 75% ‘threshold’ are we?
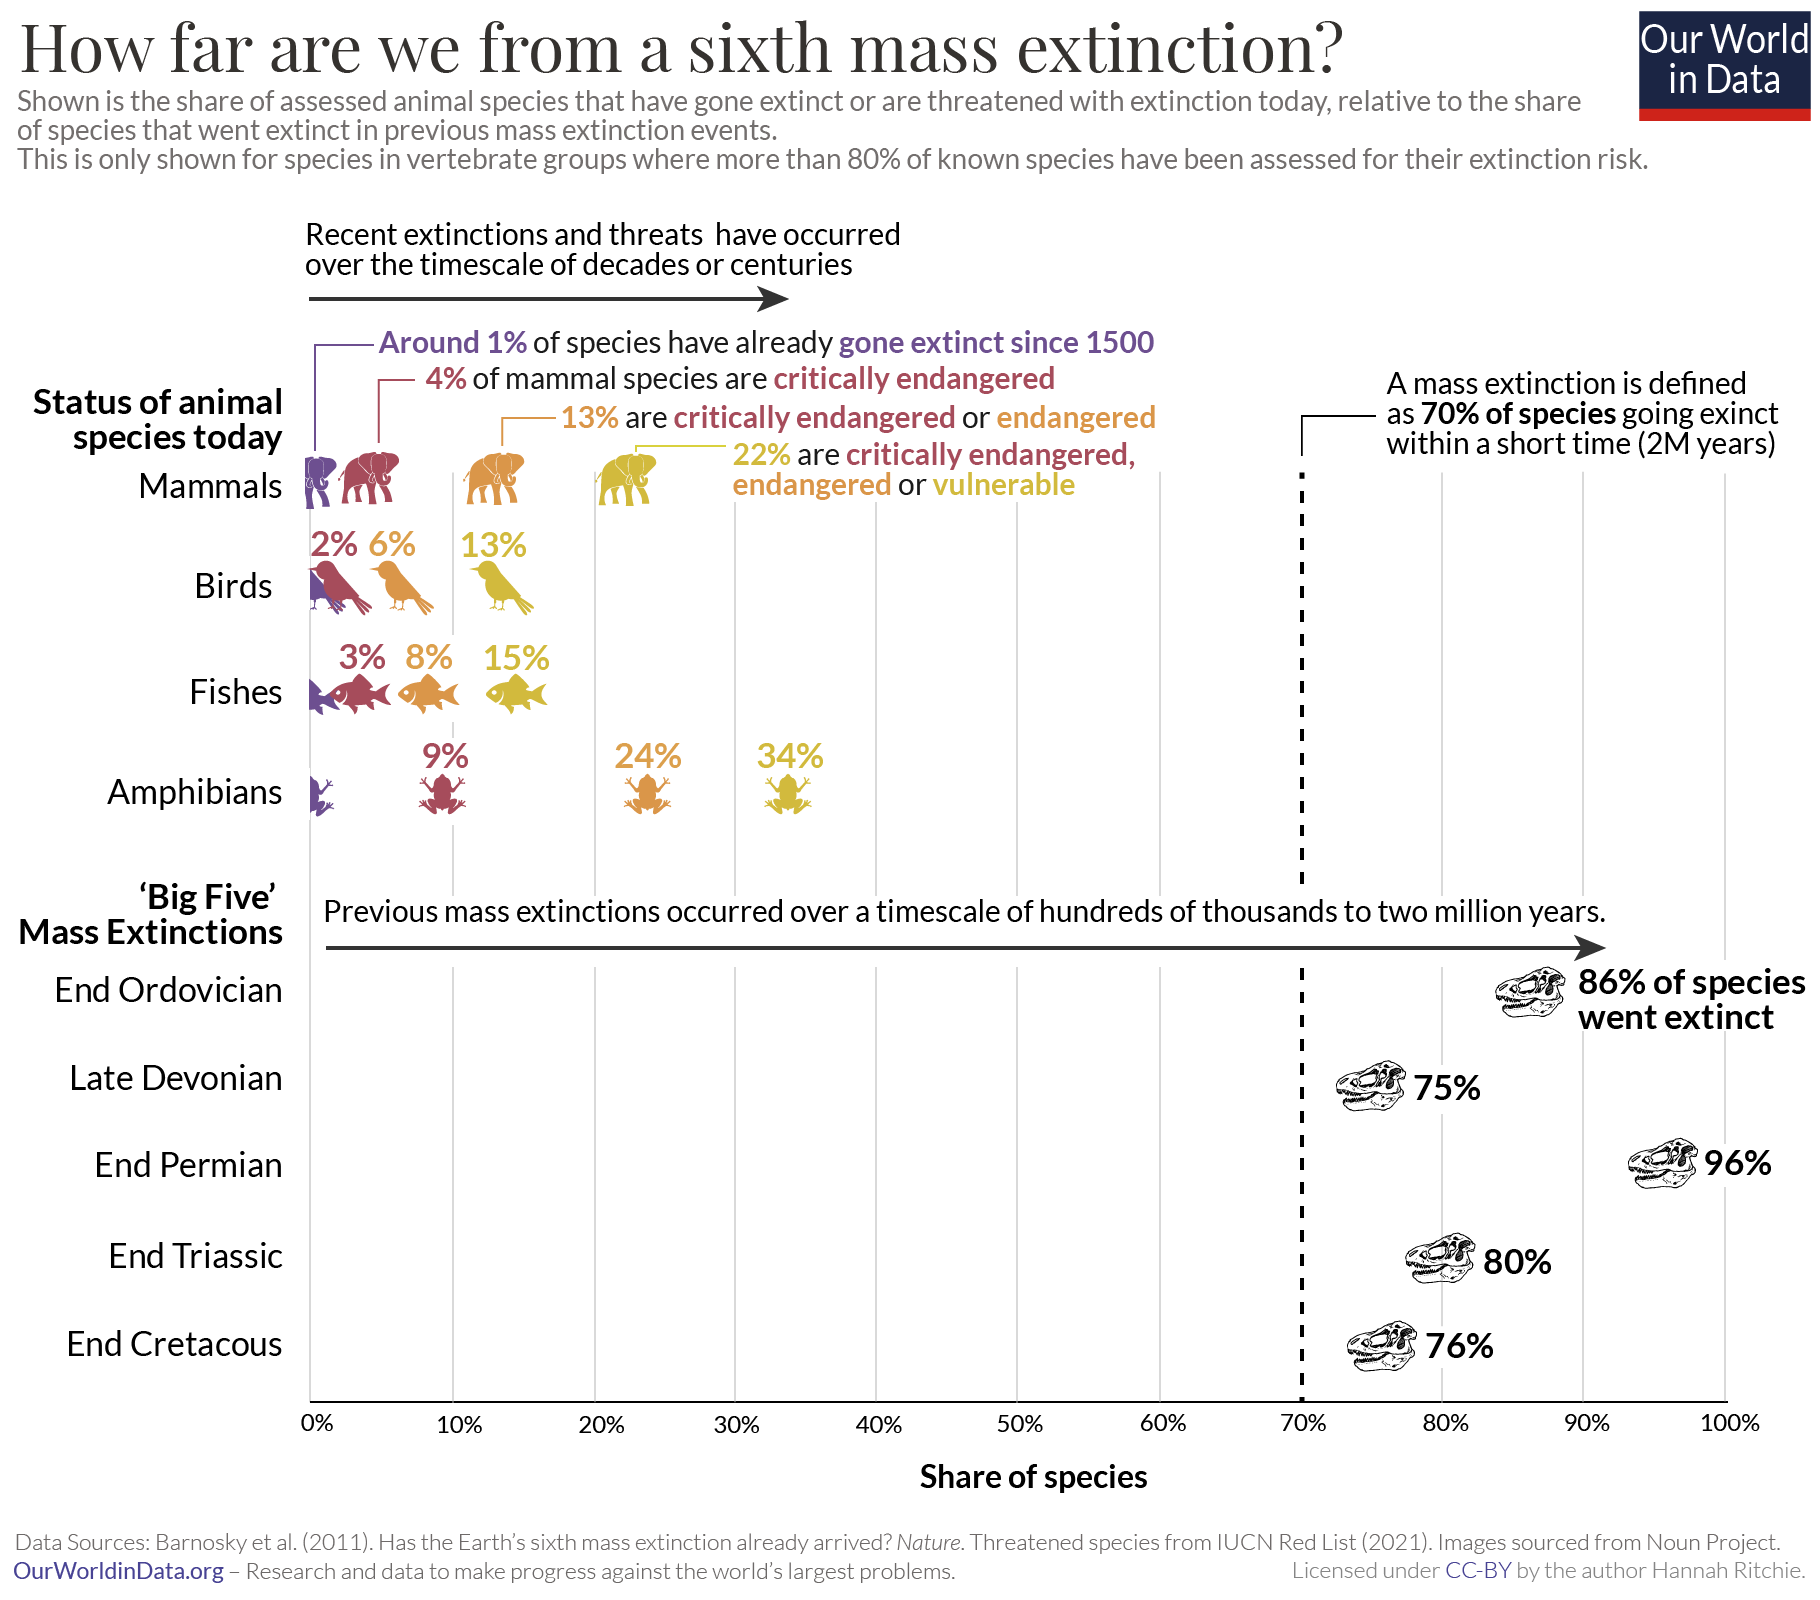
At first glance, it seems like we’re pretty far away. Since 1500 around 0.5% to 1% of the world’s assessed vertebrates have gone extinct. As we see in the chart, that’s around 1.3% of birds; 1.4% of mammals; 0.6% of amphibians; 0.2% of reptiles; and 0.2% of bony fishes. Due to the many measurement issues for these groups – and how our understanding of species has changed in recent centuries – the extinction rates that these predictions are likely an underestimate (more on this later).
So, we’ve lost around 1% of these species. But we should also consider the large number of species that are threatened with extinction. Thankfully we’ve not lost them yet, but there is a high risk that we do. Species threatened with extinction are defined by the IUCN Red List, and it encompasses several categories:
- Critically endangered species have a probability of extinction higher than 50% in ten years or three generations;
- Endangered species have a greater than 20% probability in 20 years or five generations;
- Vulnerable has a probability greater than 10% over a century.
There’s a high chance that many of these species go extinct in the new few decades. If they do, this share of extinct species changes significantly. In the chart, we also see the share of species in each group that is threatened with extinction. We would very quickly go from 1% to almost one-quarter of species. We’d be one-third of the way to the ‘75%’ line.
Again, you might think that 1%, or even 25%, is small. At least much smaller than the 75% definition of mass extinction. But what’s important is the speed at which this has happened. Previous extinctions happened over the course of a million years or more. We’re already far along the curve within only a few centuries, or even decades. We’ll see this more clearly later when we compare recent extinction rates to those of the past. But we can quickly understand this from a quick back-of-the-envelope calculation. If it took us 500 years to lose 1% of species, it would take us 37,500 years to lose 75%. Much faster than the million years of previous extinction events. Of course, this assumes that future extinctions would continue at the same rate – a big assumption, and one we will come to later. It might even be a conservative one – there might be species that went extinct without us even knowing that they existed at all.
Are recent extinction rates higher than we would expect?
There are two ways to compare recent extinction rates. First, to the natural ‘background’ rates of extinctions. Second, to the extinction rates of previous mass extinctions.
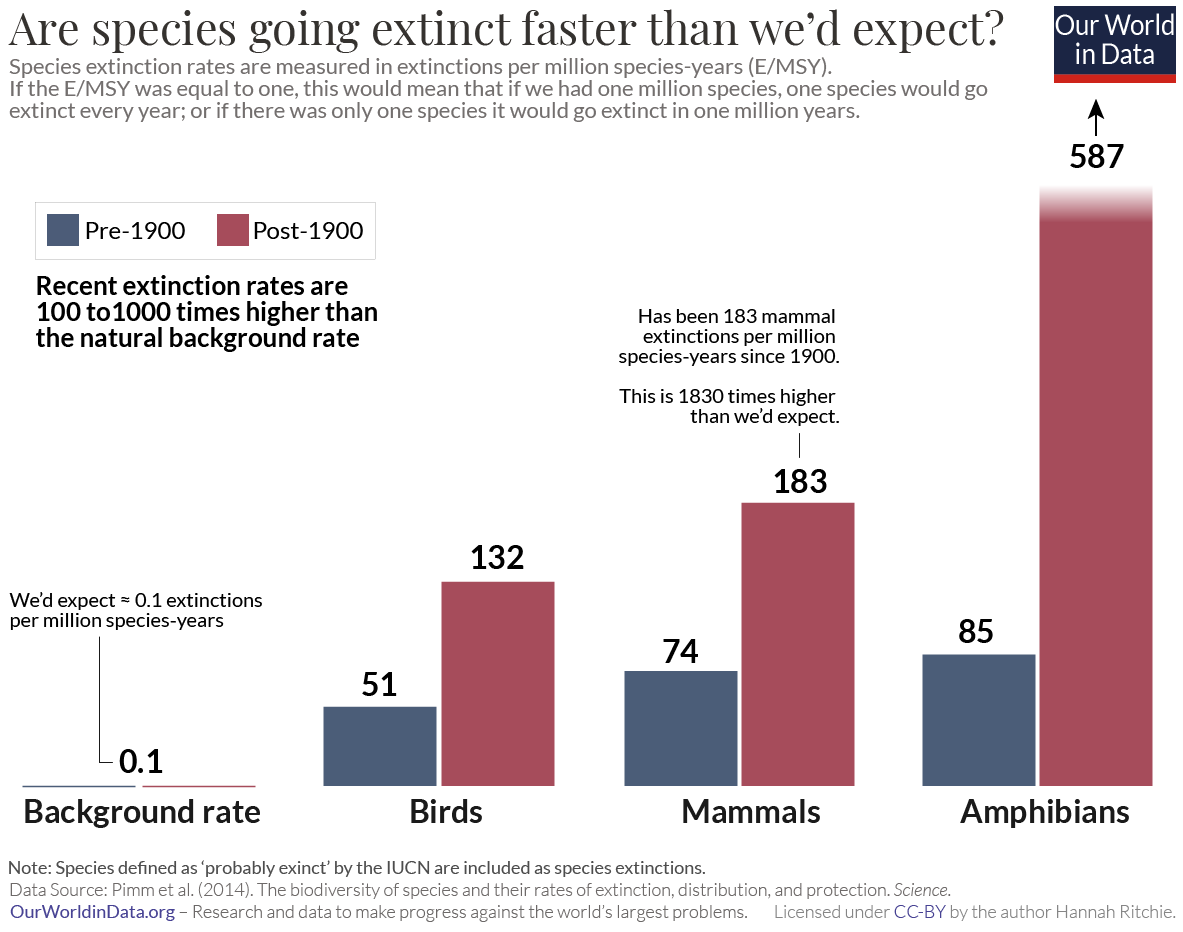
The research is quite clear that extinction rates over the last few centuries have been much higher than we’d expect. The background rate of extinction of vertebrates that we would expect is around 0.1 to 1 extinction per million species years (E/MSY).14 In the chart we see the comparison, broken down by their pre-and post-1900 rates.
Modern extinction rates average around 100 E/MSY. This means birds, mammals and amphibians have been going extinct 100 to 1000 times faster than we would expect.
Researchers think this might even be an underestimate. One reason is that some modern species are understudied. Some might have gone extinct before we had the chance to identify them. They will ultimately show up in the fossil record later, but for now, we don’t even know that they existed. This might be particularly true for species a century ago when much less resource was put into wildlife research and conservation.
Another key point is that we have many species that are not far from extinction: species that are critically endangered or endangered. There’s a high chance that many could go extinct in the coming decades. If they did, extinction rates would increase massively. In another study published in Science, Michael Hoffman and colleagues estimated that 52 species of birds, mammals and amphibians move one category closer to extinction on the IUCN Red List every year. Pimm et al. (2014) estimate that this would give us an extinction rate of 450 E/MSY. Again, 100 to 1000 times higher than the background rate.
How do recent extinction rates compare to previous mass extinctions?
Clearly, we’re killing off species much faster than would be expected. But does this fall into ‘mass extinction’ territory? Is it fast enough to be comparable to the ‘Big Five’?
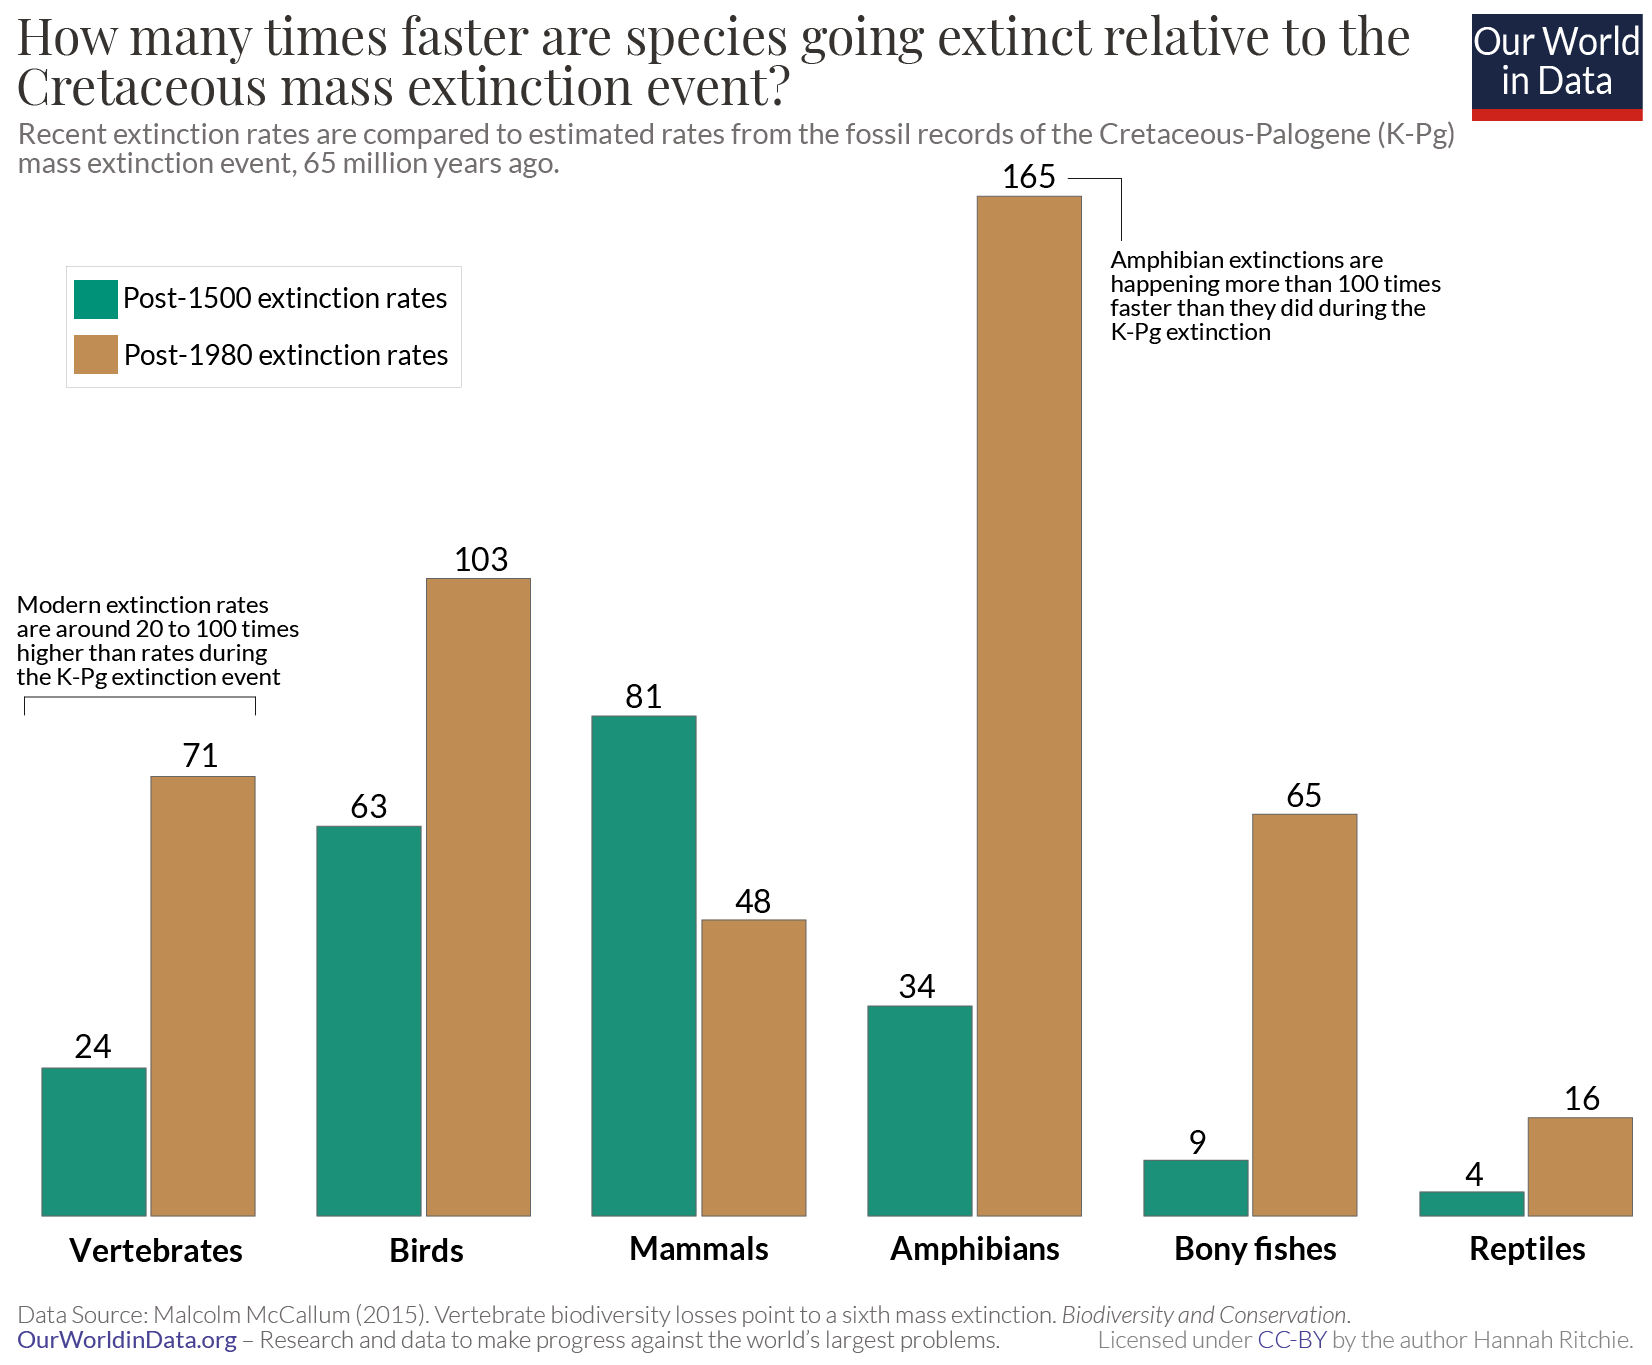
One way to answer this is to compare recent extinction rates with rates from previous mass extinctions. Researcher, Malcolm McCallum did this comparison for the Cretaceous-Paleogene (K-Pg) mass extinction. This was the event that killed off the dinosaurs around 65 million years ago. In the chart, we see the comparison of (non-dinosaur) vertebrate extinction rates during the K-Pg mass extinction to recent rates. This shows how many times faster species are now going extinct compared to then.
We see clearly that rates since the year 1500 are estimated to be 24 to 81 times faster than the K-Pg event. If we look at even more recent rates, from 1980 onwards, this increases to up to 165 times faster. Again, this might even be understating the pace of current extinctions. We have many species that are threatened with extinction: there is a high probability that many of these species go extinct within the next century. If we were to include species classified as ‘threatened’ on the IUCN Red List, extinctions would be happening thousands of times faster than the K-Pg extinction.
This makes the point clear: we’re not only losing species at a much faster rate than we’d expect, but we’re also losing them tens to thousands of times faster than the rare mass extinction events in Earth’s history.
How long would it take for us to reach the sixth mass extinction?
Recent rates of extinction, if they continued, would put us on course for a sixth mass extinction. A final way to check the numbers on this is to estimate how long it would take for us to get there. On our current path, how long before 75% of species went extinct? If this number is less than 2 million years, it would qualify as a mass extinction event.
Earlier we came up with a crude estimate for this number. If it took us 500 years to lose 1% of species, it would take us 37,500 years to lose 75%. That assumes extinctions continue at the average rate over that time. Malcolm McCallum’s analysis produced a similar order of magnitude: 54,000 years for vertebrates based on post-1500 extinction rates. Extinction rates have been faster over the past 50 years. So if we take the post-1980 extinction rates, we’d get there even faster: in only 18,000 years.
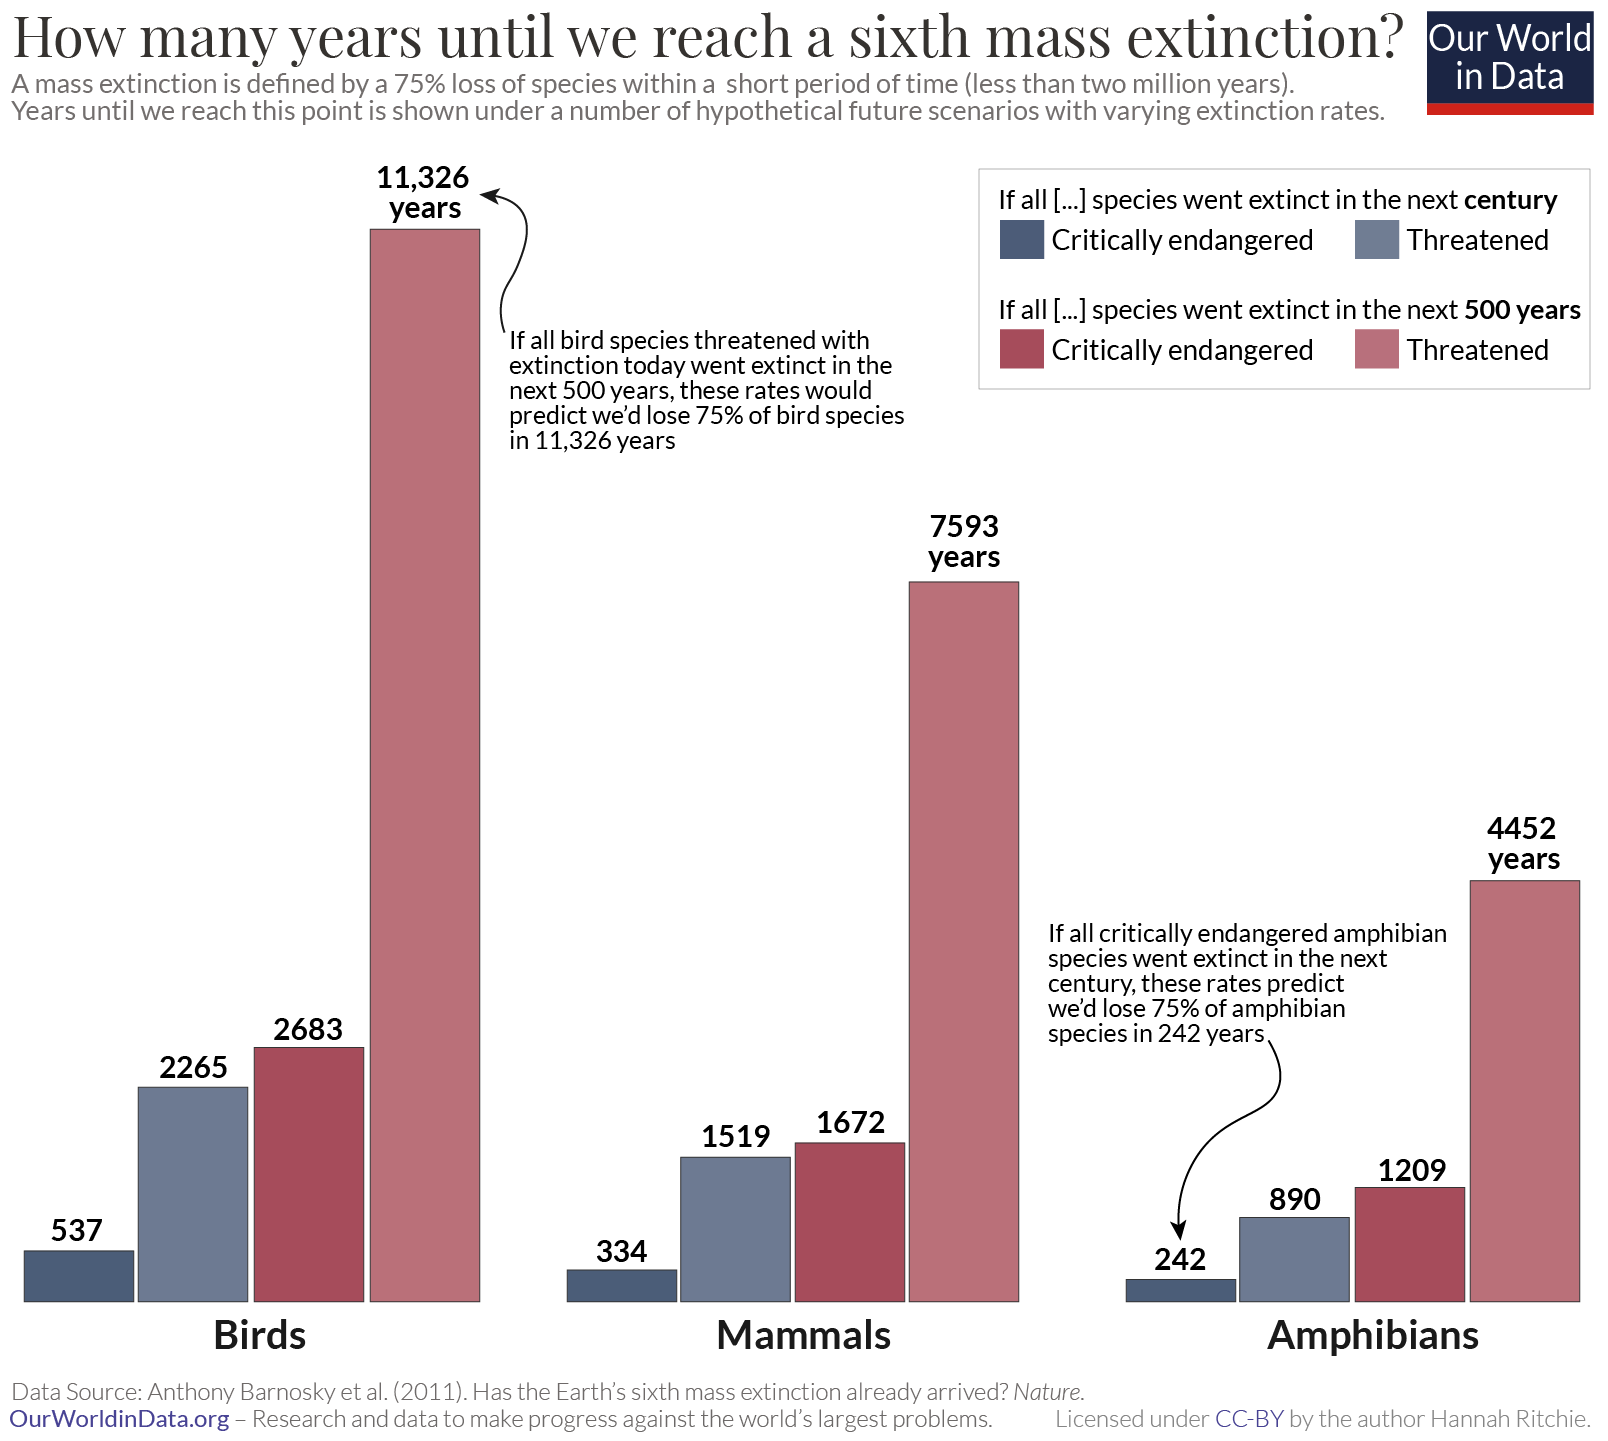
But again, this doesn’t account for the large number of species that are threatened with extinction today. If these species did go extinct soon, our extinction rates would be much higher than the average over the last 500 years. In a study published in Nature, Anthony Barnosky and colleagues looked at the time it would take for 75% of species to go extinct across four scenarios.
- If all species classified as ‘critically endangered’ went extinct in the next century;
- If all species classified as ‘threatened’ went extinct in the next century;
- If all species classified as ‘critically endangered’ went extinct in the next 500 years;
- If all species classified as ‘threatened’ went extinct in the next 500 years.
To be clear: these are not predictions of the future. We can think of them as hypotheticals of what could happen if we don’t take action to protect the world’s threatened species. In each case, the assumed extinction rate would be very different, and this has a significant impact on the time needed to cross the ‘mass extinction’ threshold. The results are shown in the chart.
In the most extreme case, where we lose all of our threatened species in the next 100 years, it would take only 250 to 500 years before 75% of the world’s birds, mammals and amphibians went extinct. If only our critically endangered animals went extinct in the next century, this would increase to a few thousand years. If these extinctions happened much slower – over 500 years rather than a century – it’d be around 5,000 to 10,000 years. In any scenario, this would happen much faster than the million-year timescale of previous mass extinctions.
This makes two points very clear. First, extinctions are happening at a rapid rate – up to 100 times faster than the ‘Big Five’ events that define our planet’s history. Current rates do point towards a sixth mass extinction. Second, these are scenarios of what could happen. It doesn’t have to be this way.
The good news: we can prevent a sixth mass extinction
There is one thing that sets the sixth mass extinction apart from the previous five. It can be stopped. We can stop it. The ‘Big Five’ mass extinctions were driven by a cascade of disruptive events – volcanism, ocean acidification, natural swings in climate. There was no one or nothing to hit the brakes and turn things around.
This time it’s different. We are the primary driver of these environmental changes: deforestation, climate change, ocean acidification, hunting, and pollution of ecosystems. That’s depressing. But is also the best news we could hope for. It means we have the opportunity (and some would argue the responsibility) to stop it. We can protect the world’s threatened species from going extinct; we can slow and reverse deforestation; slow global climate change; and allow natural ecosystems to heal. There are a number of examples of where we have been successful in preventing these extinctions [see our article on species conservation].
The conclusion that we’re on course for a sixth mass extinction hinges on the assumption that extinctions will continue at their recent rates. Or, worse, that they will accelerate. Nothing about that is inevitable. To stop it, we need to understand where and why the world’s species are going extinct. This is the first step to understanding what we can do to turn things around. This is what our work on Biodiversity aims to achieve.
How many species has conservation saved from extinction?
It’s hard to find good news on the state of the world’s wildlife. Many predict that we’re heading for a sixth mass extinction; the Living Planet Index reports a 68% average decline in wildlife populations since 1970, and we continue to lose the tropical habitats that support our most diverse ecosystems. The United Nations Convention on Biological Diversity set 20 twenty targets – the Aichi Biodiversity Targets – to be achieved by 2020. The world missed all of them. We didn’t meet a single one.

Perhaps, then, the loss of biodiversity is unavoidable. Maybe there is nothing we can do to turn things around.
Thankfully there are signs of hope. As we will see, conservation action might have been insufficient to meet our Aichi targets, but it did make a difference. Tens of species were saved through these interventions. There’s other evidence that protected areas have retained bird diversity in tropical ecosystems. And each year there are a number of species that move away from the extinction zone on the IUCN Red List.

We need to make sure these stories of success are heard. Of course, we shouldn’t use them to mask the bad news. They definitely don’t make up for the large losses in wildlife we’re seeing around the world. In fact, the risk here is asymmetric: growth in one wildlife population does not offset a species getting pushed to extinction. A species lost to extinction is a species lost forever. We can’t make up for this loss by simply increasing the population of something else. But we can make sure two messages are communicated at the same time.
First, that we’re losing our biodiversity at a rapid rate. Second, that it’s possible to do something about it. If there was no hope of the second one being true, what would be the point of trying? If our actions really made no difference then why would governments support any more conservation efforts? No, we need to be vocal about the positives as well as the negatives to make clear that progress is possible. And, importantly, understand what we did right so that we can do more of it.
In this article, I want to take a look at some of these positive trends, and better understand how we achieved them.
Pulling animals back from the brink of extinction
For anyone interested in wildlife conservation, losing a species to extinction is a tragedy. Saving a species is surely one of life’s greatest successes.
Conservation efforts might have saved tens of beautiful species over the last few decades. The 12th Aichi Target was to ‘prevent the extinction of known threatened species. We might have missed this, but efforts have not been completely in vain.
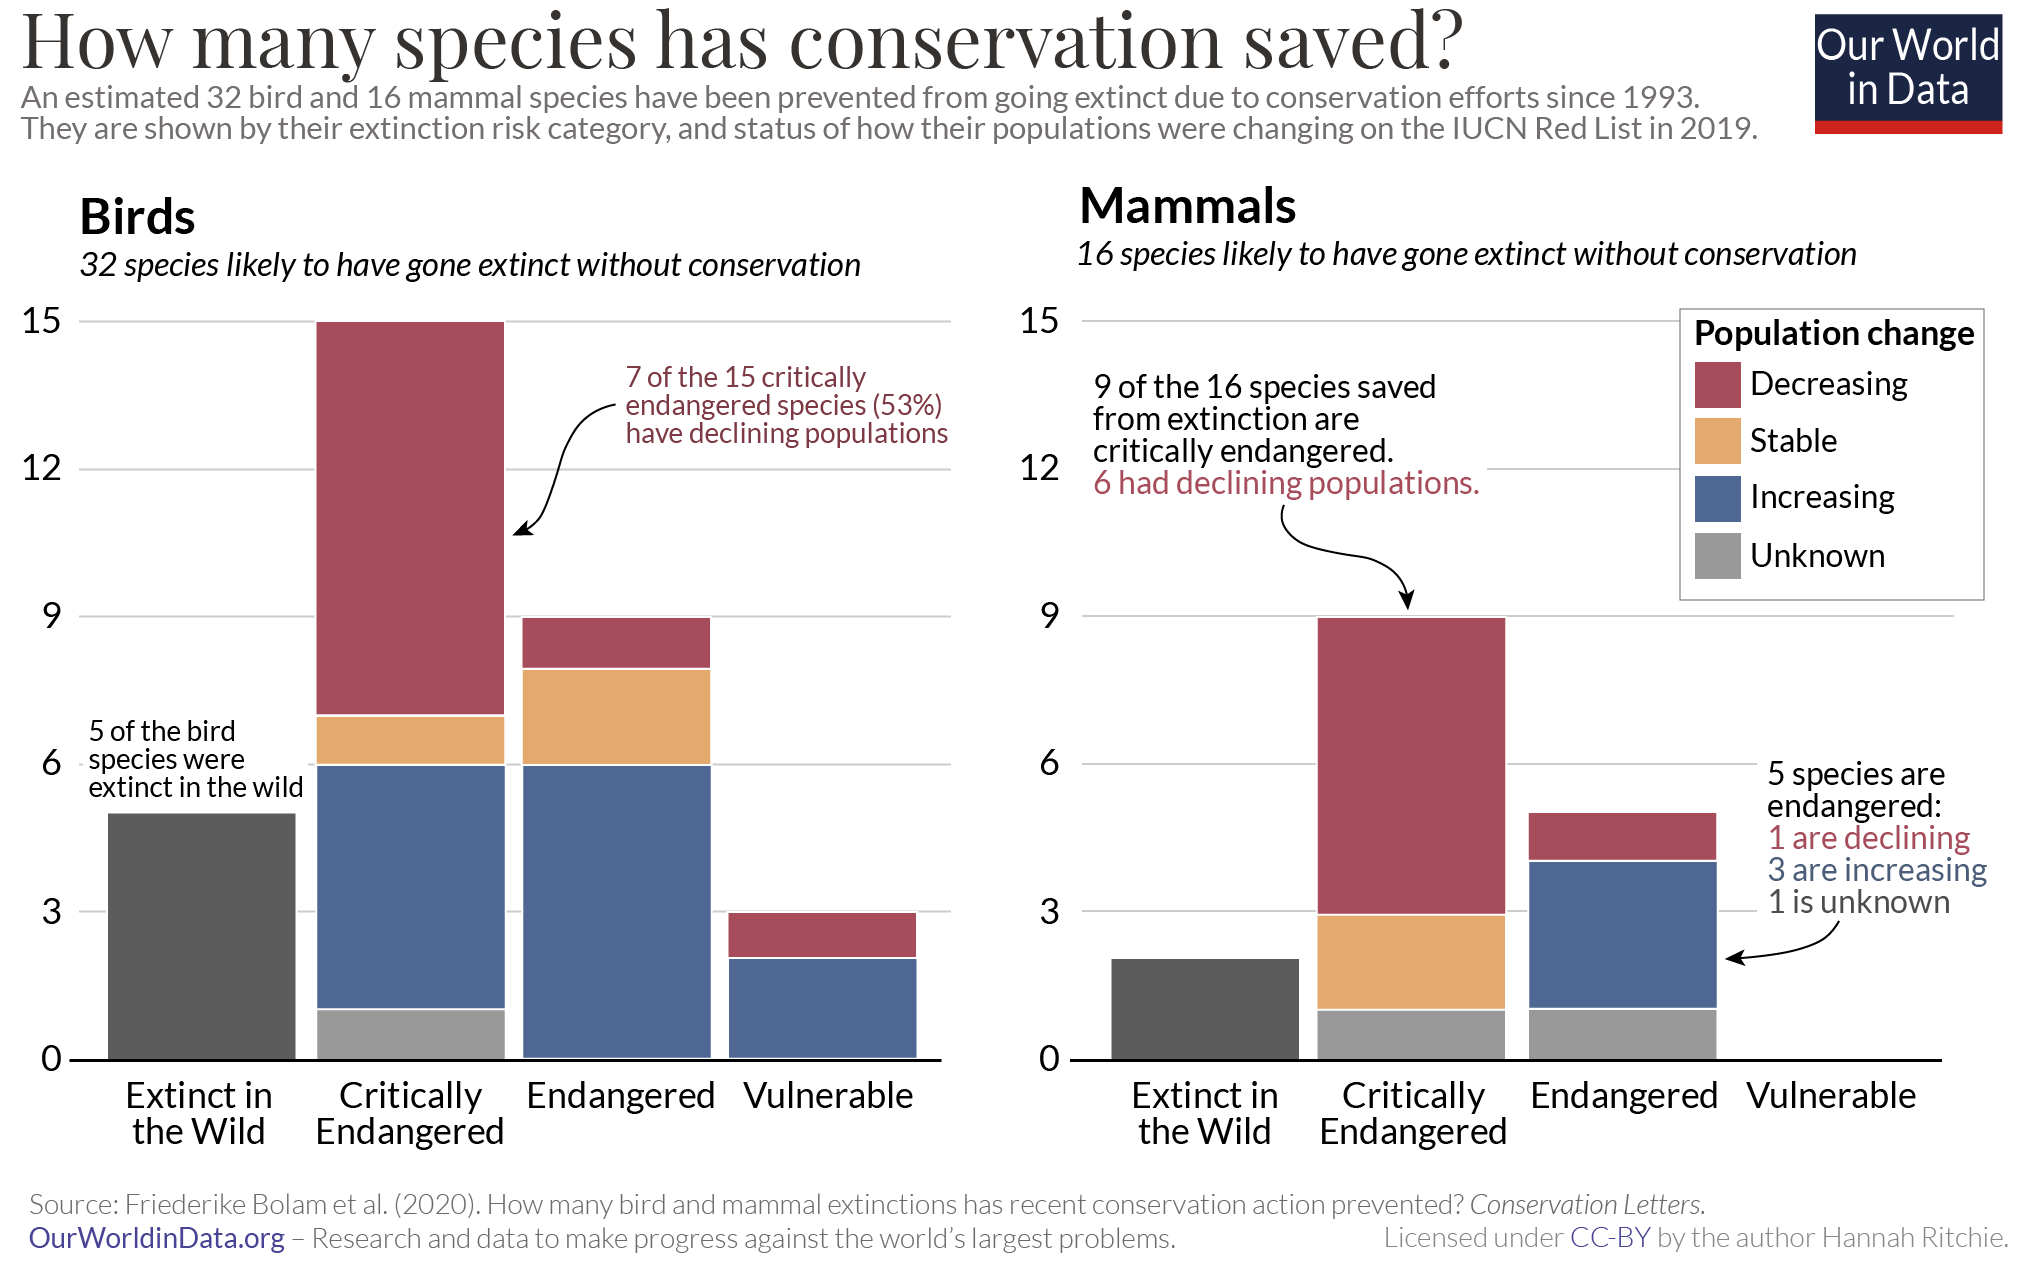
In a recent study published in Conservation Letters, researchers estimate that between 28 and 48 bird and mammal species would have gone extinct without the conservation efforts implemented when the Convention on Biological Diversity came into force in 1993.21 21 to 32 bird species, and 7 to 16 mammal species were pulled back from the brink of extinction. In the last decade alone (from 2010 to 2020), 9 to 18 bird, and 2 to 7 mammal extinctions were prevented. This has preserved hundreds of millions of years of evolutionary history. It prevented the loss of 120 million years of the evolutionary history of birds, and 26 million years for mammals.
What this means is that extinction rates over the last two decades would have been at least three to four times faster without conservation efforts.
This does not mean that these species are out of danger. In fact, the populations of some of these species are still decreasing. We see this in the chart, which shows how the populations of these bird and mammal species that were expected to have gone extinct are changing. 16% of these bird species and 13% of the mammal species have gone extinct in the wild, but conservation has allowed them to survive in captivity. Across the critically endangered, endangered and vulnerable categories, 53% of birds and 31% of mammal species have increasing or stable populations. This is positive but makes clear that many of these species are still in decline. Conservation has only been able to slow these losses down.
This only looks at species on the brink of extinction. Many species in serious but less-threatened categories have been prevented from moving closer to extinction. Around 52 species of mammals, birds and amphibians move one category closer to extinction every year. Without conservation, this number would be 20% higher.
There are more examples. Studies have shown that protected areas have had a positive impact on preserving bird species in tropical forests. These are some of the world’s most threatened ecosystems. And while the IUCN Red List usually makes for a depressing read, there are some success stories. This year the European Bison, Europe’s largest land mammals, was moved from ‘Vulnerable’ to ‘Near threatened’ (meaning it’s less threatened with extinction) thanks to continued conservation efforts. We will look at more European success stories later.
Friederike Bolam et al. (2021) looked at what conservation actions were key to saving the mammal and bird species deemed to be destined for extinction. For both birds and mammals, legal protection and the growth of protected areas was important. Protected areas are not perfect – there are countless examples of poorly managed areas where populations continue to shrink. We will look at how effective protected areas are in a follow-up article. But, on average, they do make a difference. Clearly, these efforts were critical for species that had gone extinct in the wild. Other important factors were controlling the spread of invasive species into new environments; reintroducing old species into environments where they had been previously lost; and restoring natural habitats, such as wetlands and forests.
Restoring wildlife populations across Europe
The European Bison might steal the headlines, but there are many good news stories across Europe. Many of the drivers of biodiversity loss – deforestation, overhunting, and habitat loss – are happening in the tropics today. But these same changes also happened across Europe and North America. Only, they happened earlier – centuries ago.
Europe is now trying to restore its lost wildlife and habitats through rewilding programmes. The Zoological Society of London, Birdlife International and European Bird Census Council published a report which details how these efforts are going. They looked at how the populations of 18 mammals and 19 of Europe’s iconic but endangered bird species had changed over the past 50 years.
Most had seen an overwhelming recovery. Most species saw an increase of more than 100%. Some saw more than 1000% growth. Brown bear populations more than doubled over these 50 years. Wolverine populations doubled in the 1990s alone. The Eurasian lynx increased by 500%. Reintroduction programmes of the Eurasian beaver saw populations increase by 14,000% – a doubling or tripling every decade.
What were the main drivers of this recovery?
Part of Europe’s success in restoring wildlife populations in recent decades can be attributed to the fact that their development and harvesting of resources came long ago. My European ancestors had already hunted many species to extinction; expanded agricultural land into the existing forest; and built cities, roads and other infrastructure that fragments natural habitats. Only in our very recent past have European countries been able to reverse these trends: reforesting; raising livestock instead of hunting; and now reducing the amount of land we use for agriculture through improved productivity.
But there have also been a number of proactive interventions to restore populations. In the chart here we see the main drivers of recovery across European bird species. At the top of the list is habitat restoration – the re-establishment of wetlands, grasslands, forests and other national habitats. Reintroduction of species has also been key. But protecting existing habitats and species has been equally important. Legal site protections and bans on shooting have been the main recovery drivers of almost as many species.
After millennia of habitat loss and exploitation by humans, wildlife is coming back to Europe. Somewhat ironically, humans have played an important role in this.
While most biodiversity trends point towards a barren future for the planet’s wildlife, there are success stories to draw upon. These should not make us complacent or deflect our attention from the seriousness of these losses. But I think it is important to highlight what we have achieved. Protecting the world’s wildlife is not impossible – we’ve just seen the counter-evidence to this. To commit to wider conservation efforts we need to shout more loudly about these wins. Otherwise, policymakers will turn their backs on them and we will lose many beautiful species that we could and should have saved.